Along Bogotá's Hydrology Network
Overview
This project evaluates flood hazard exposure for urban blocks (manzanas) in Bogotá, Colombia. The analysis combines two official hazard datasets — river overflow and levee/dike failure — with Bogotá's hydrology network and a 100-meter proximity buffer to classify each city block into four levels of flood risk.
The workflow was completed in two independent environments: a Jupyter Notebook using GeoPandas and Matplotlib, and a custom ArcGIS Pro Python toolbox (FloodingRisk.pyt) that replicates the same geospatial logic. Both environments produced consistent spatial outputs, demonstrating reproducibility across platforms and proficiency in GIS programming, geoprocessing automation, and cartographic design.
Risk Classification System
Each urban block receives a RISK_CAT attribute based on whether it intersects a flood hazard polygon, falls within the 100m hydrology buffer, both, or neither. This four-tier system prioritizes blocks with compounding exposure.
Hazard & Buffer
Block lies within a hazard zone AND within 100m of hydrology — highest combined exposure.
Only Hazard
Block intersects a flood hazard polygon but lies outside the 100m hydrology buffer.
Only Buffer
Block falls within 100m of the drainage network but outside official hazard polygons.
None
Block does not intersect any hazard zone or hydrology buffer — lowest flood exposure.
Data Sources
All datasets were obtained from official Colombian geospatial data authorities and were downloaded specifically for this analysis.
| Dataset | Filename | Source | Role |
|---|---|---|---|
| Overflow Flood Hazard | Amenaza_IN_desbordamiento_20211229.shp |
IDECA / IDIGER | Flood hazard zones from river overflow (desbordamiento) |
| Levee Failure Hazard | Amenaza_IN_rompimiento_jarillon_20211229.shp |
IDECA / IDIGER | Hazard zones from dike/levee failure (rompimiento de jarillón) |
| Hydrology Network | Drenaje.shp |
IDECA | Rivers, creeks, channels & stormwater paths — basis for 100m buffer |
| Urban Blocks | MANZANA.shp |
IDECA / SDP | Cadastral block polygons — unit of analysis |
| Bogotá Boundary | bogotapoly.shp |
IDECA | Distrito Capital extent — used to clip all layers |
Dual-Environment Implementation
The complete spatial workflow was implemented in two independent environments, producing identical RISK_CAT results and validating the analytical approach across platforms.
Jupyter Notebook — GeoPandas
- Load all datasets and merge two hazard shapefiles
- Reproject all layers to EPSG:3116 (MAGNA-SIRGAS)
- Clip hazard, hydrology, and blocks to Bogotá boundary
- Buffer hydrology lines 100m and dissolve into single polygon
- Spatial overlay to flag
IN_HAZARDandIN_BUFFERper block - Assign
RISK_CATvia.apply(classify)row function - Export two Matplotlib map layouts (context + risk classification)
ArcGIS Pro — Python Toolbox (.pyt)
- Custom
FloodingRisk.pytwith 7 configurable parameters - Projects inputs, merges hazards with
HAZ_TYPEfield - Clips polygons, polylines, and blocks to urban boundary
- Buffers hydrology network by user-defined distance
- Flags blocks with
IN_HAZARDandIN_BUFFER - Computes
RISK_CATusing identical four-category logic - Outputs feature class to geodatabase; packaged as
.gpkx
Processing Workflow
Project & Clip
All inputs reprojected to EPSG:3116 and clipped to the Bogotá Distrito Capital boundary polygon.
Merge Hazards
Overflow and levee-failure polygons merged into a single unified layer with a HAZ_TYPE attribute field.
Buffer Network
100m buffer generated around all hydrology lines, dissolved into one continuous proximity polygon.
Classify Blocks
Each block flagged with IN_HAZARD and IN_BUFFER, then assigned a final RISK_CAT value.
ArcGIS Pro Python Toolbox
FloodingRisk.pyt — Tool Parameters
The custom toolbox accepts seven inputs, replicating all GeoPandas processing steps as native ArcPy geoprocessing operations. The tool was validated, documented via ArcGIS Pro's Metadata Editor, and successfully packaged as a geoprocessing package (.gpkx) for distribution.
Jupyter Notebook — Execution Screenshots
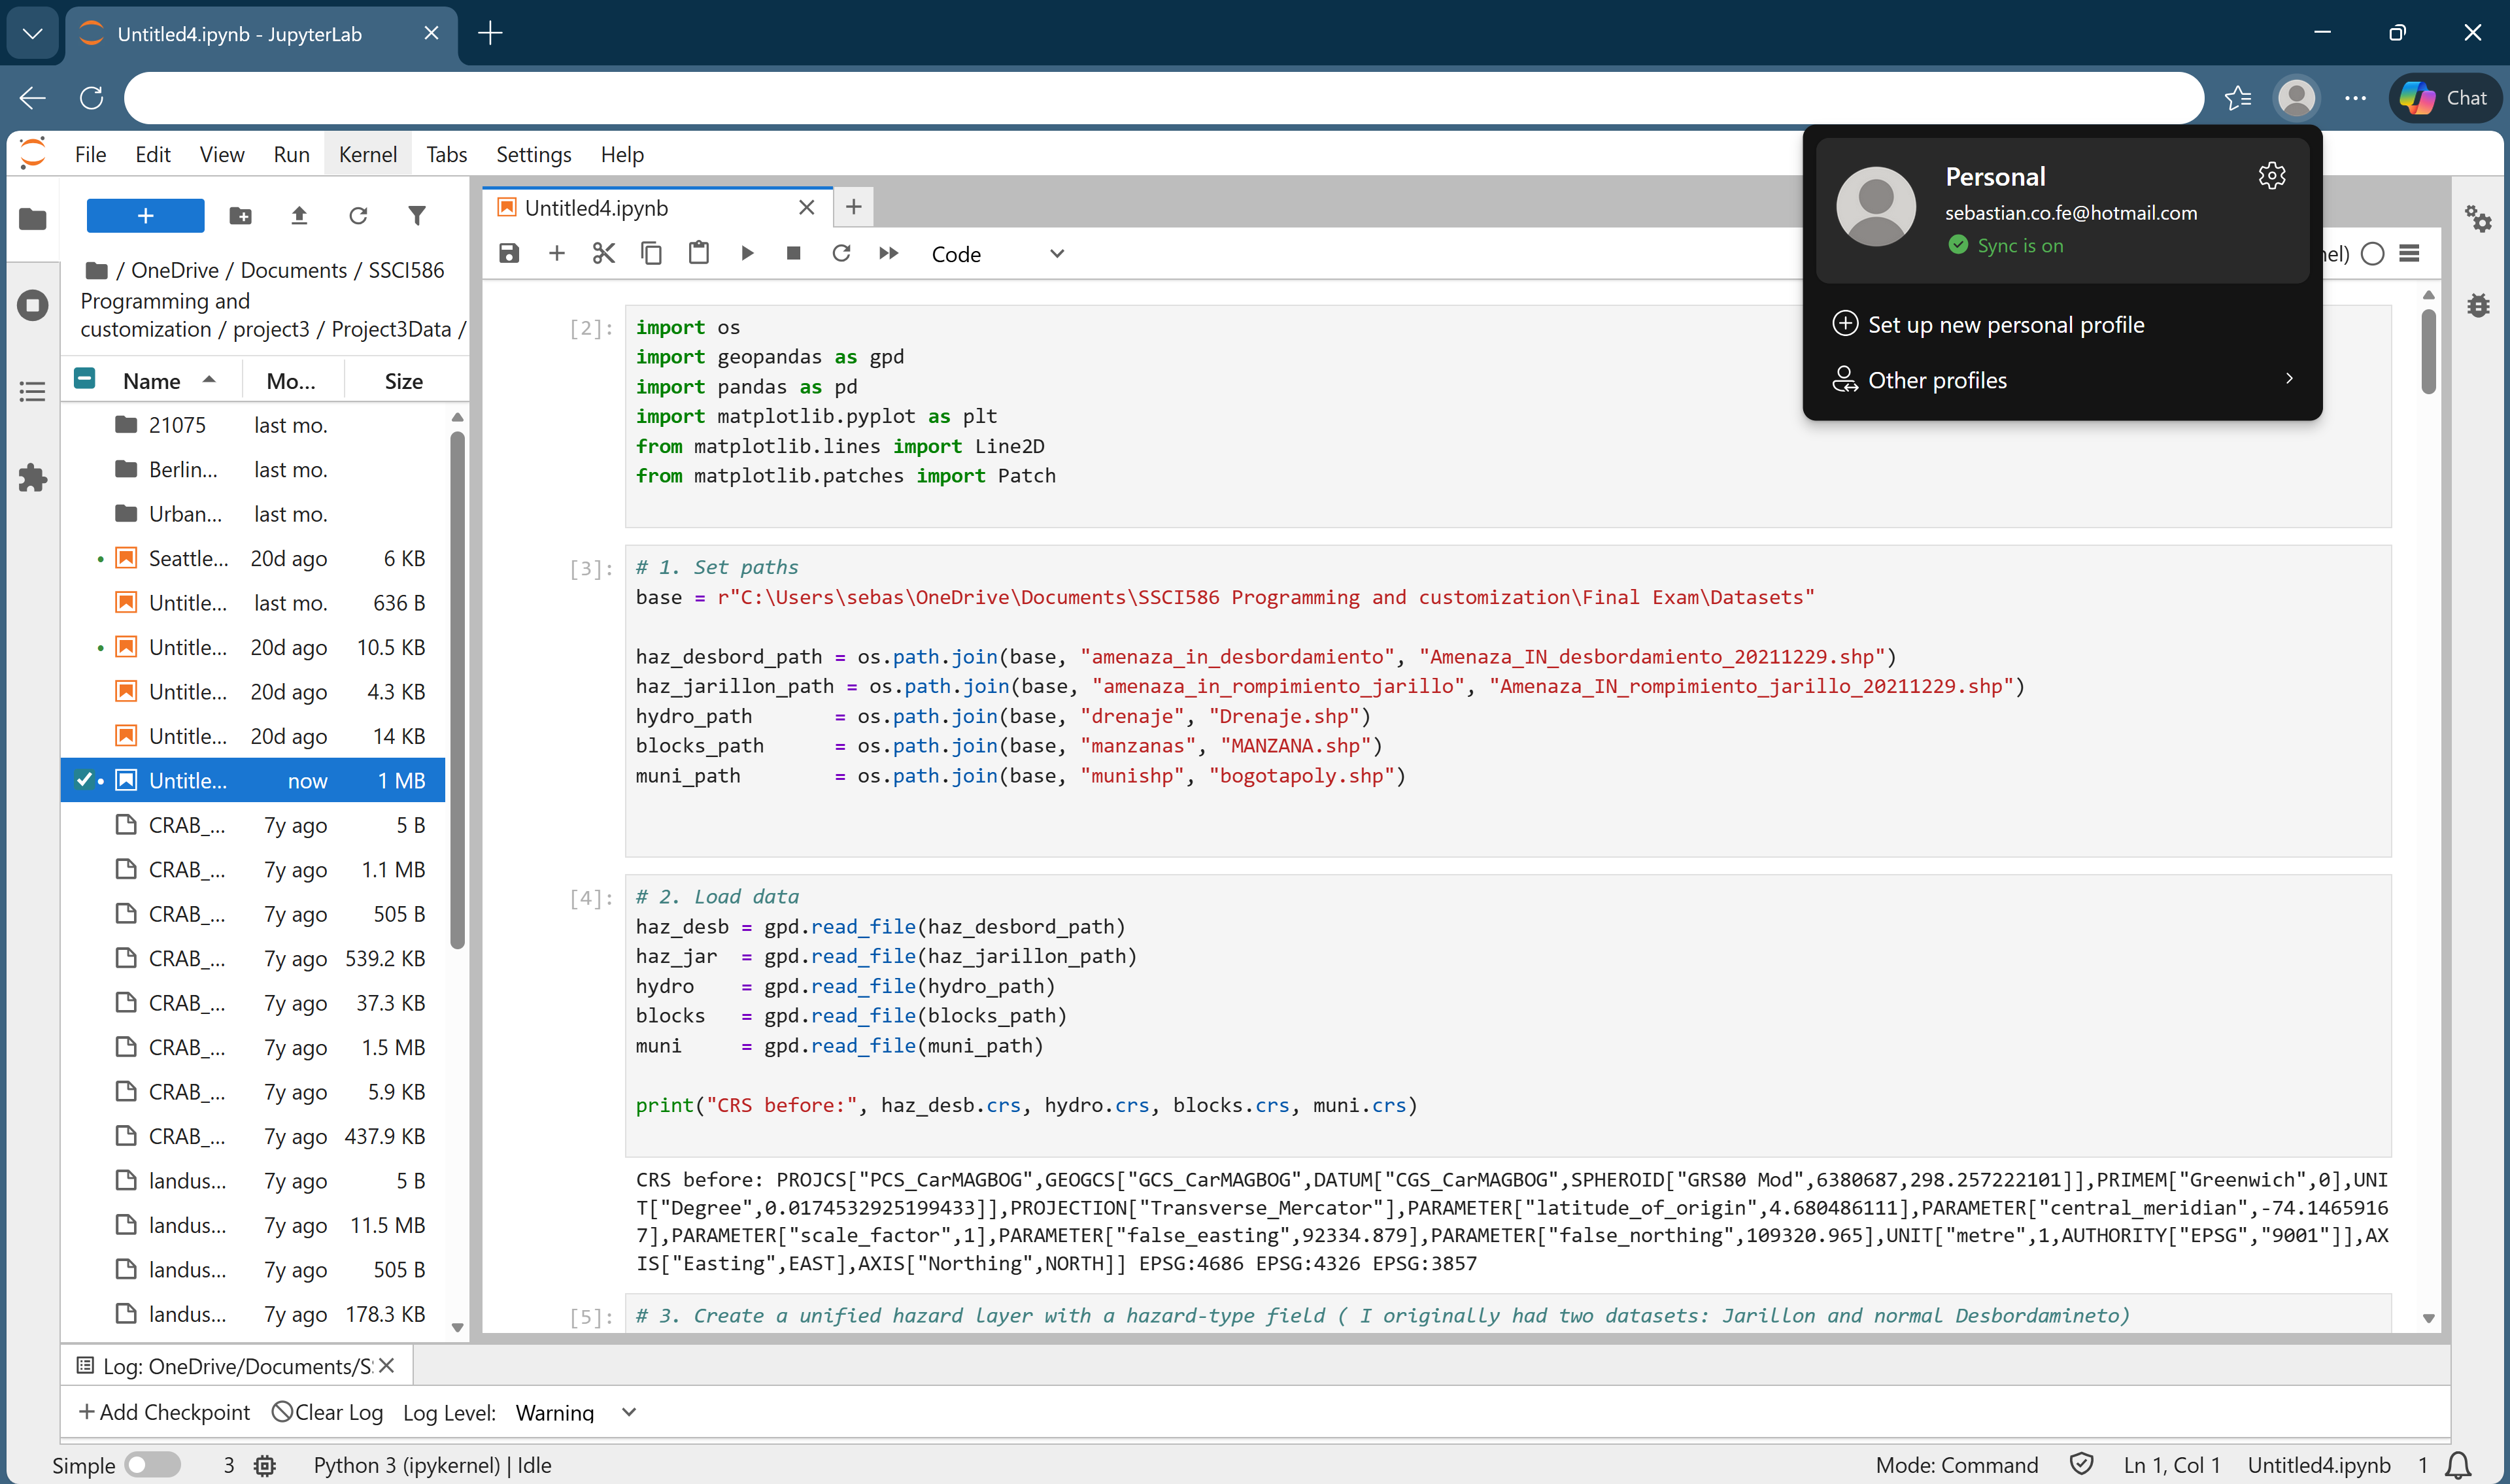
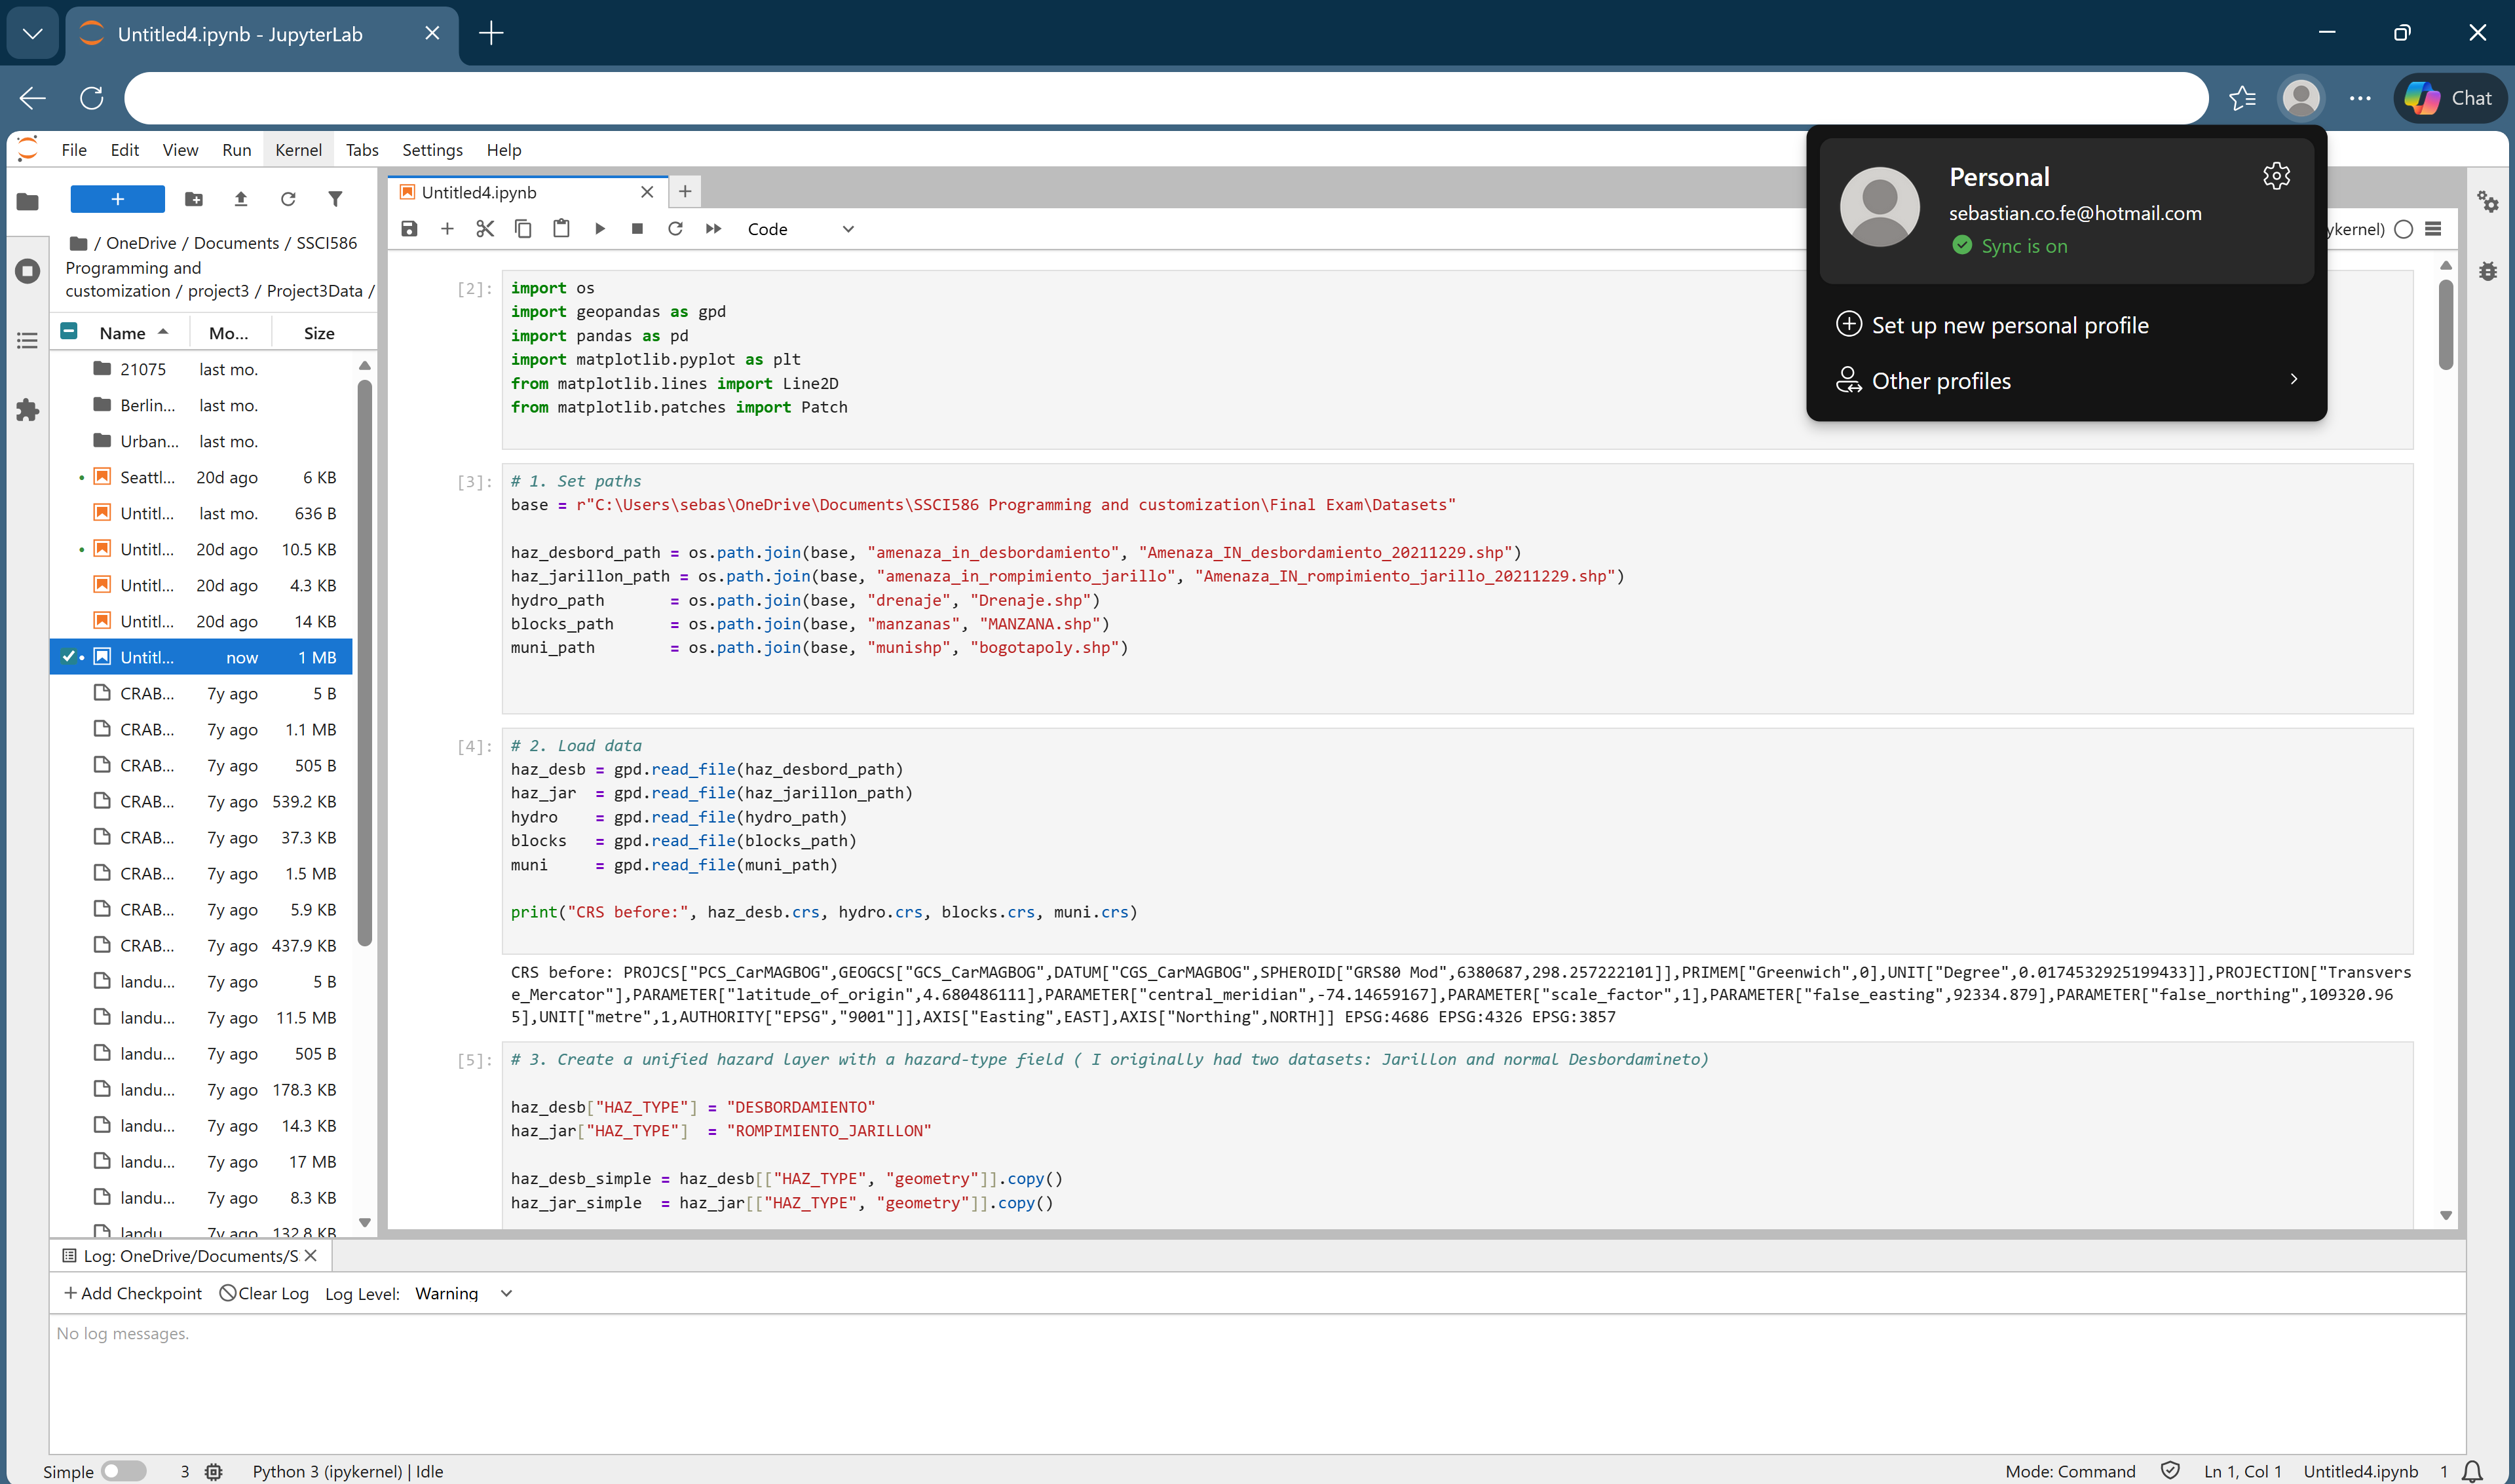
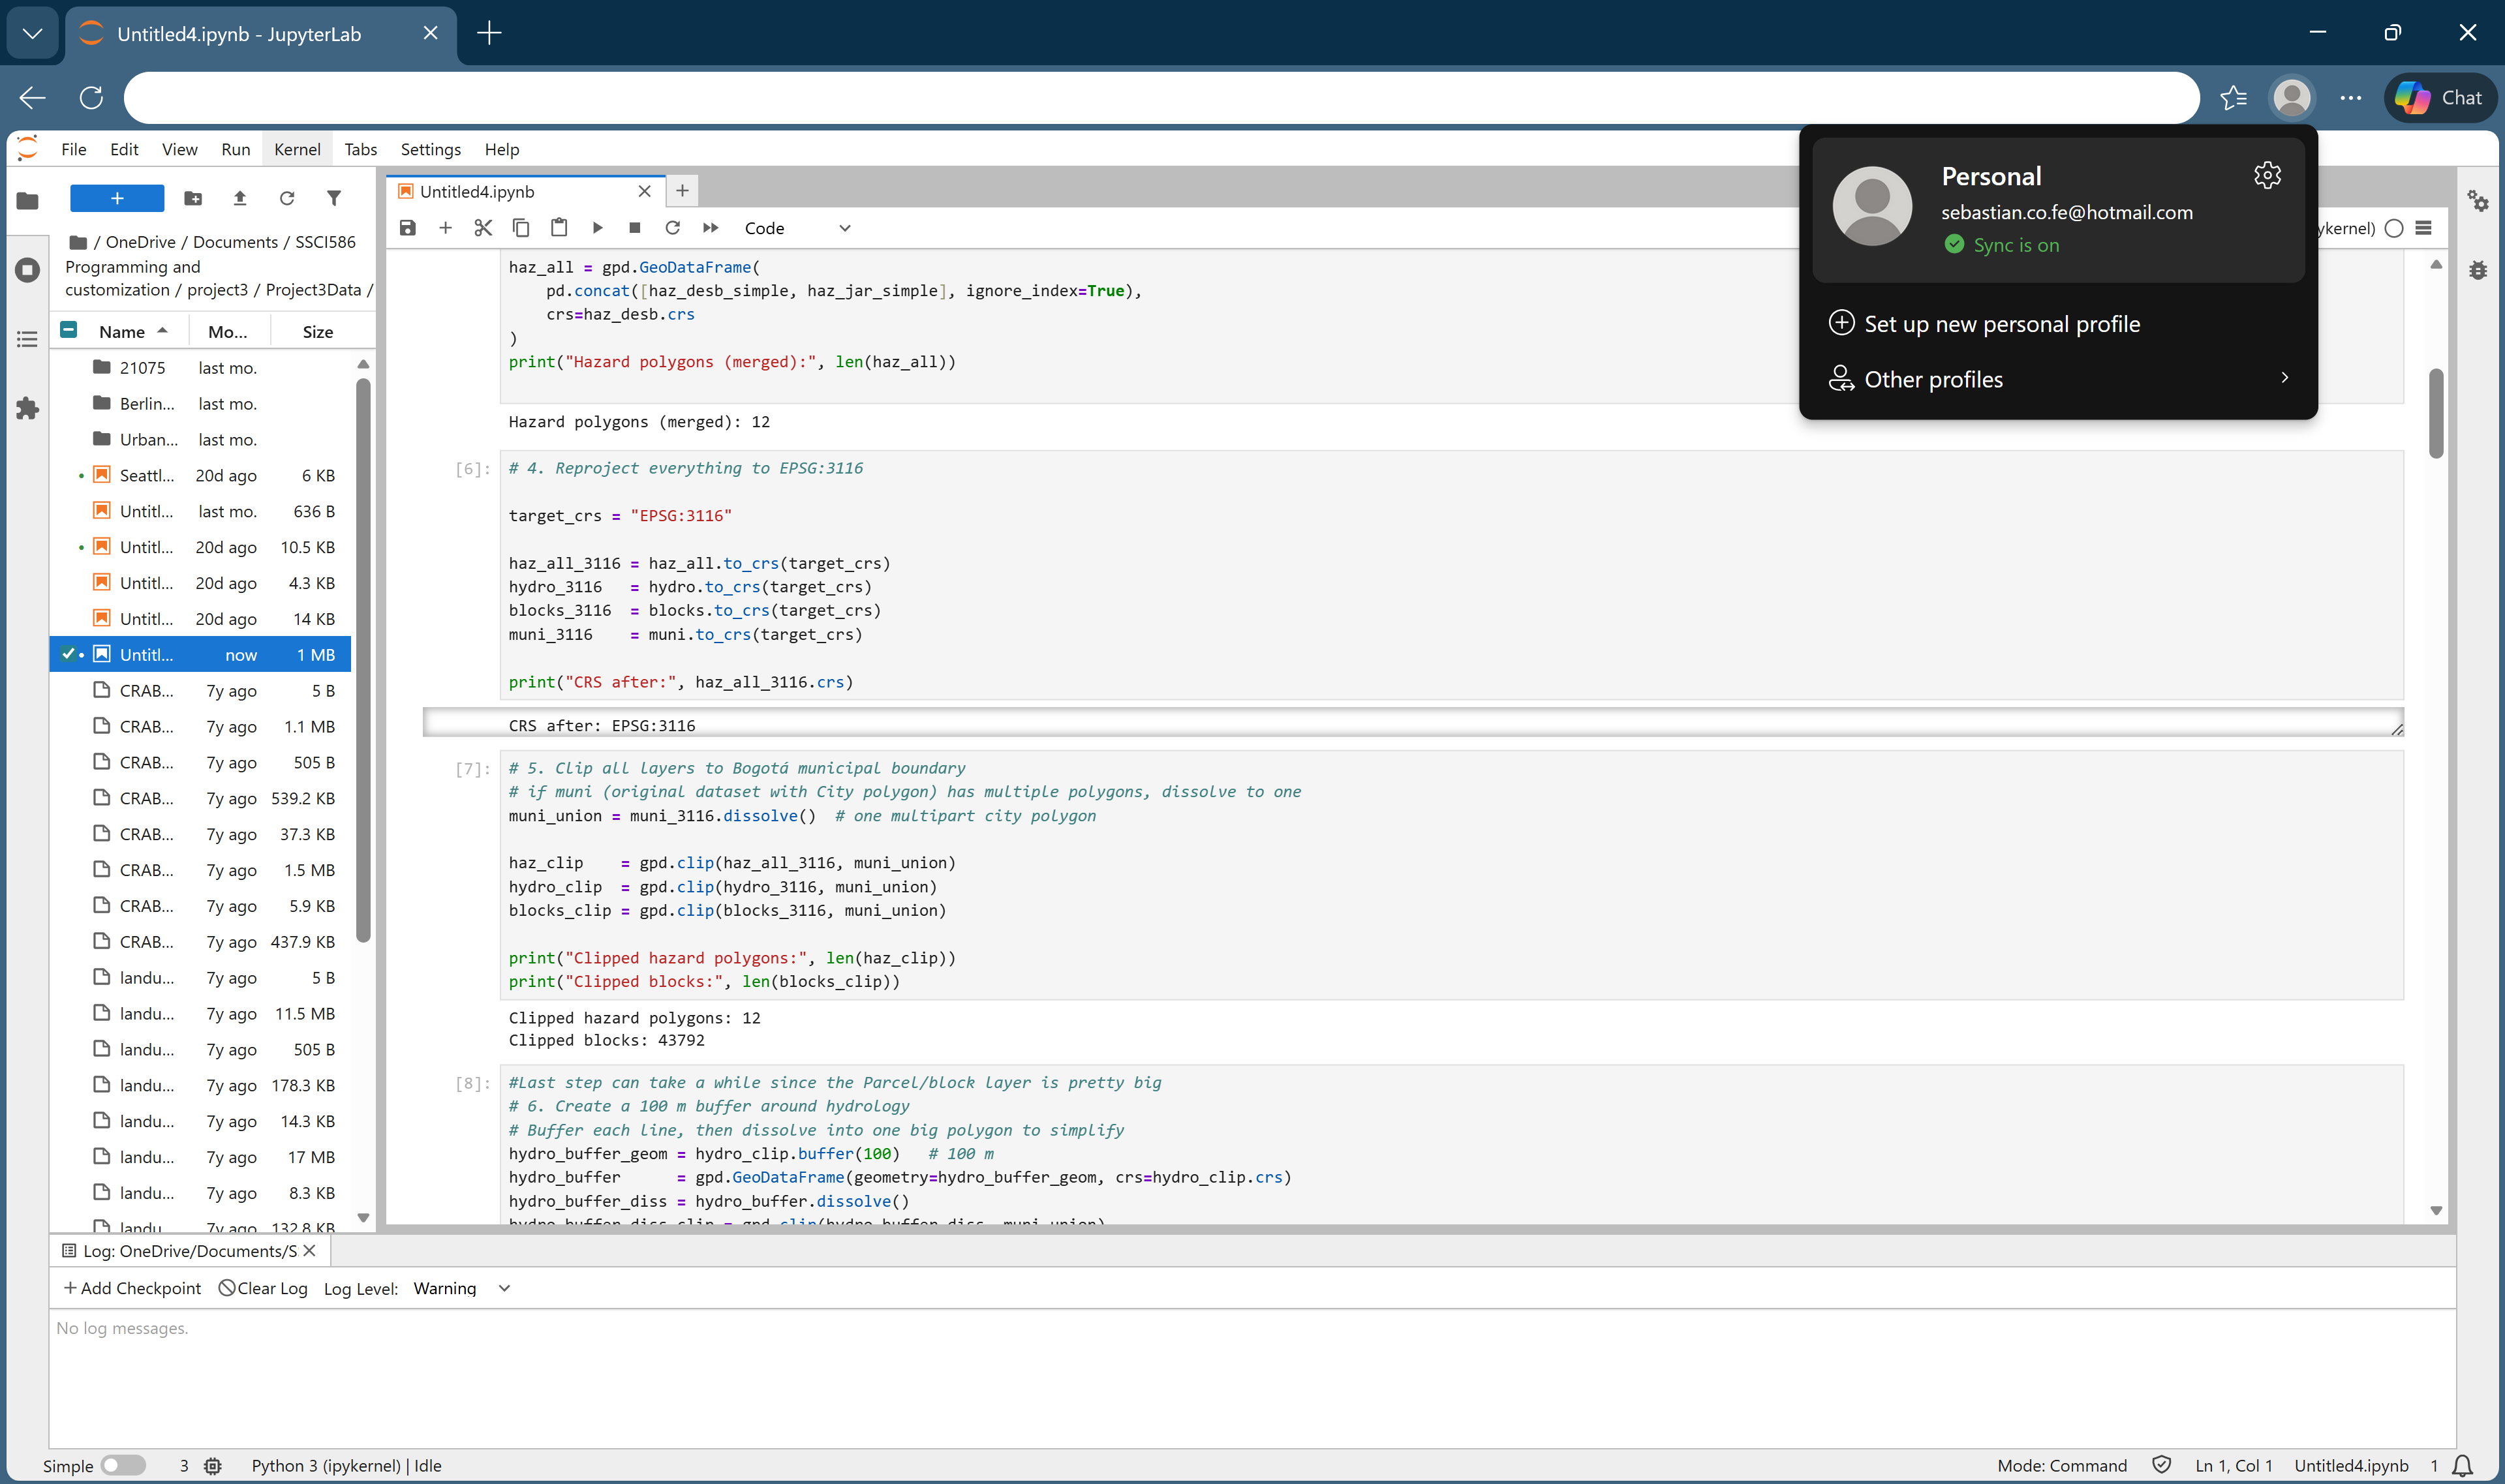
Unified hazard layer creation & reprojection to EPSG:3116
Hydrology buffer generation & RISK_CAT block classification
Spatial overlay logic — IN_HAZARD and IN_BUFFER flags assigned
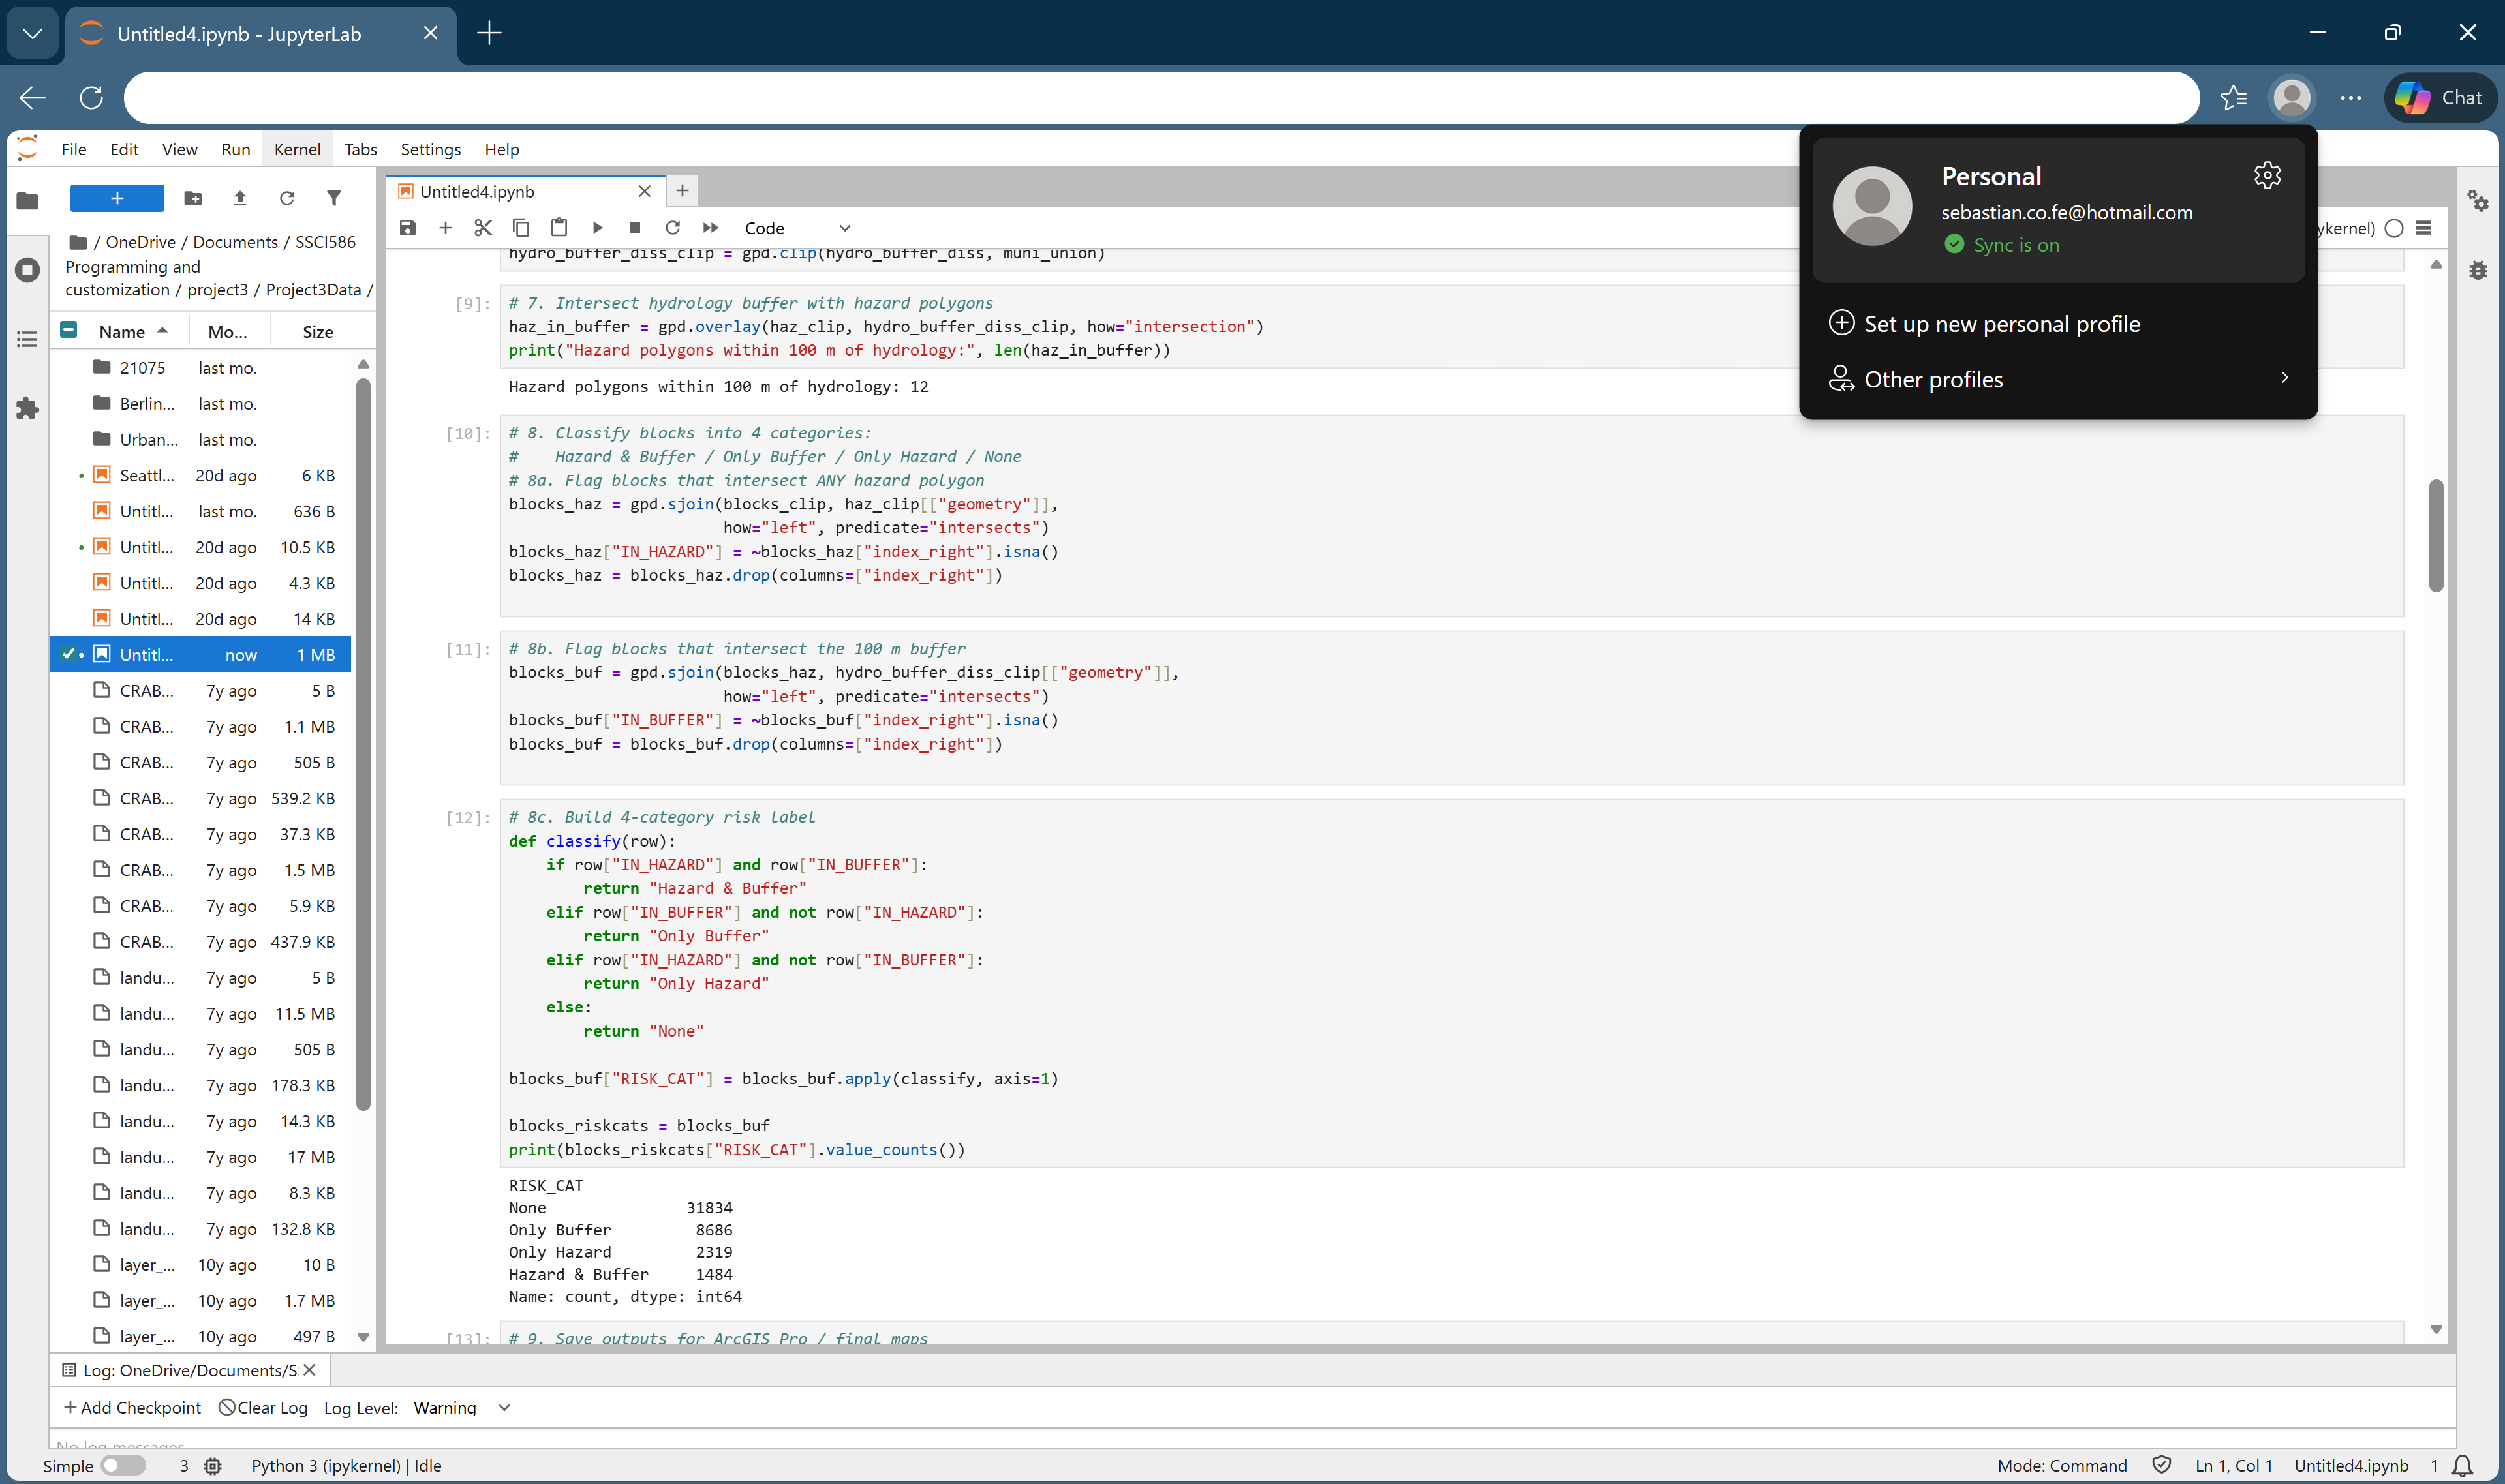
RISK_CAT value counts — four categories assigned across all blocks
Matplotlib Output Maps
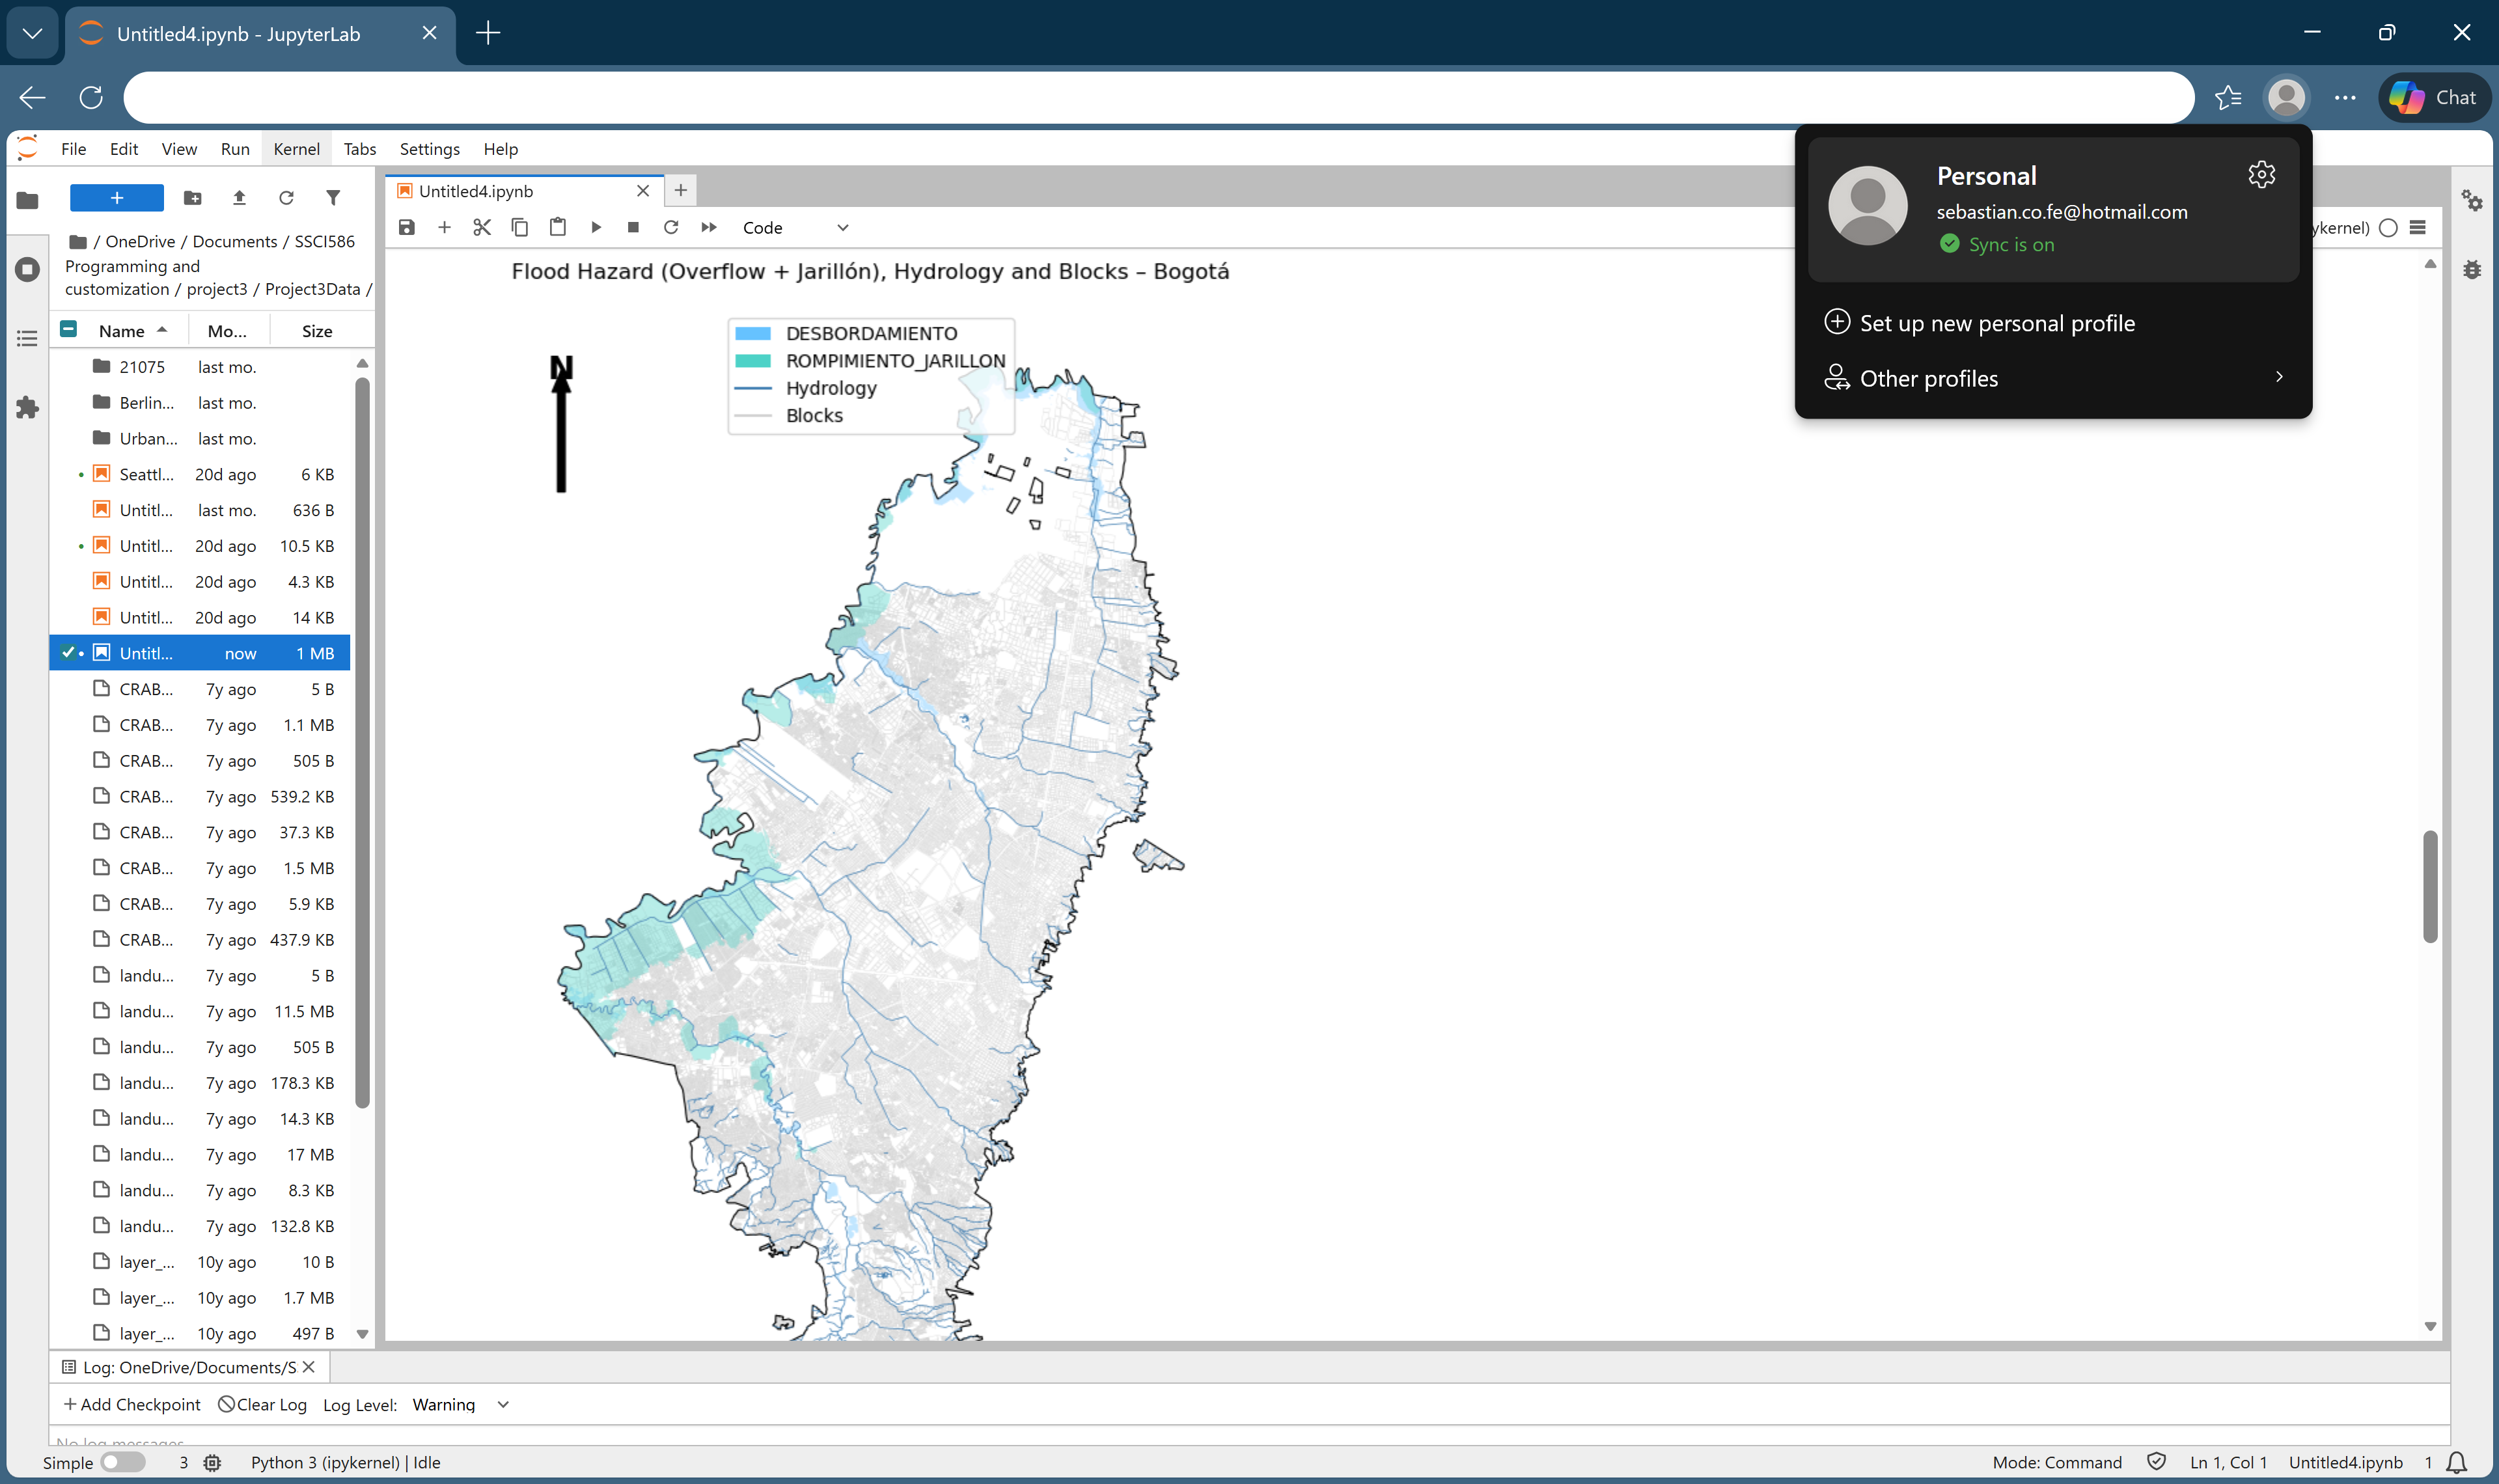
Context map — flood hazard polygons, hydrology network & urban blocks
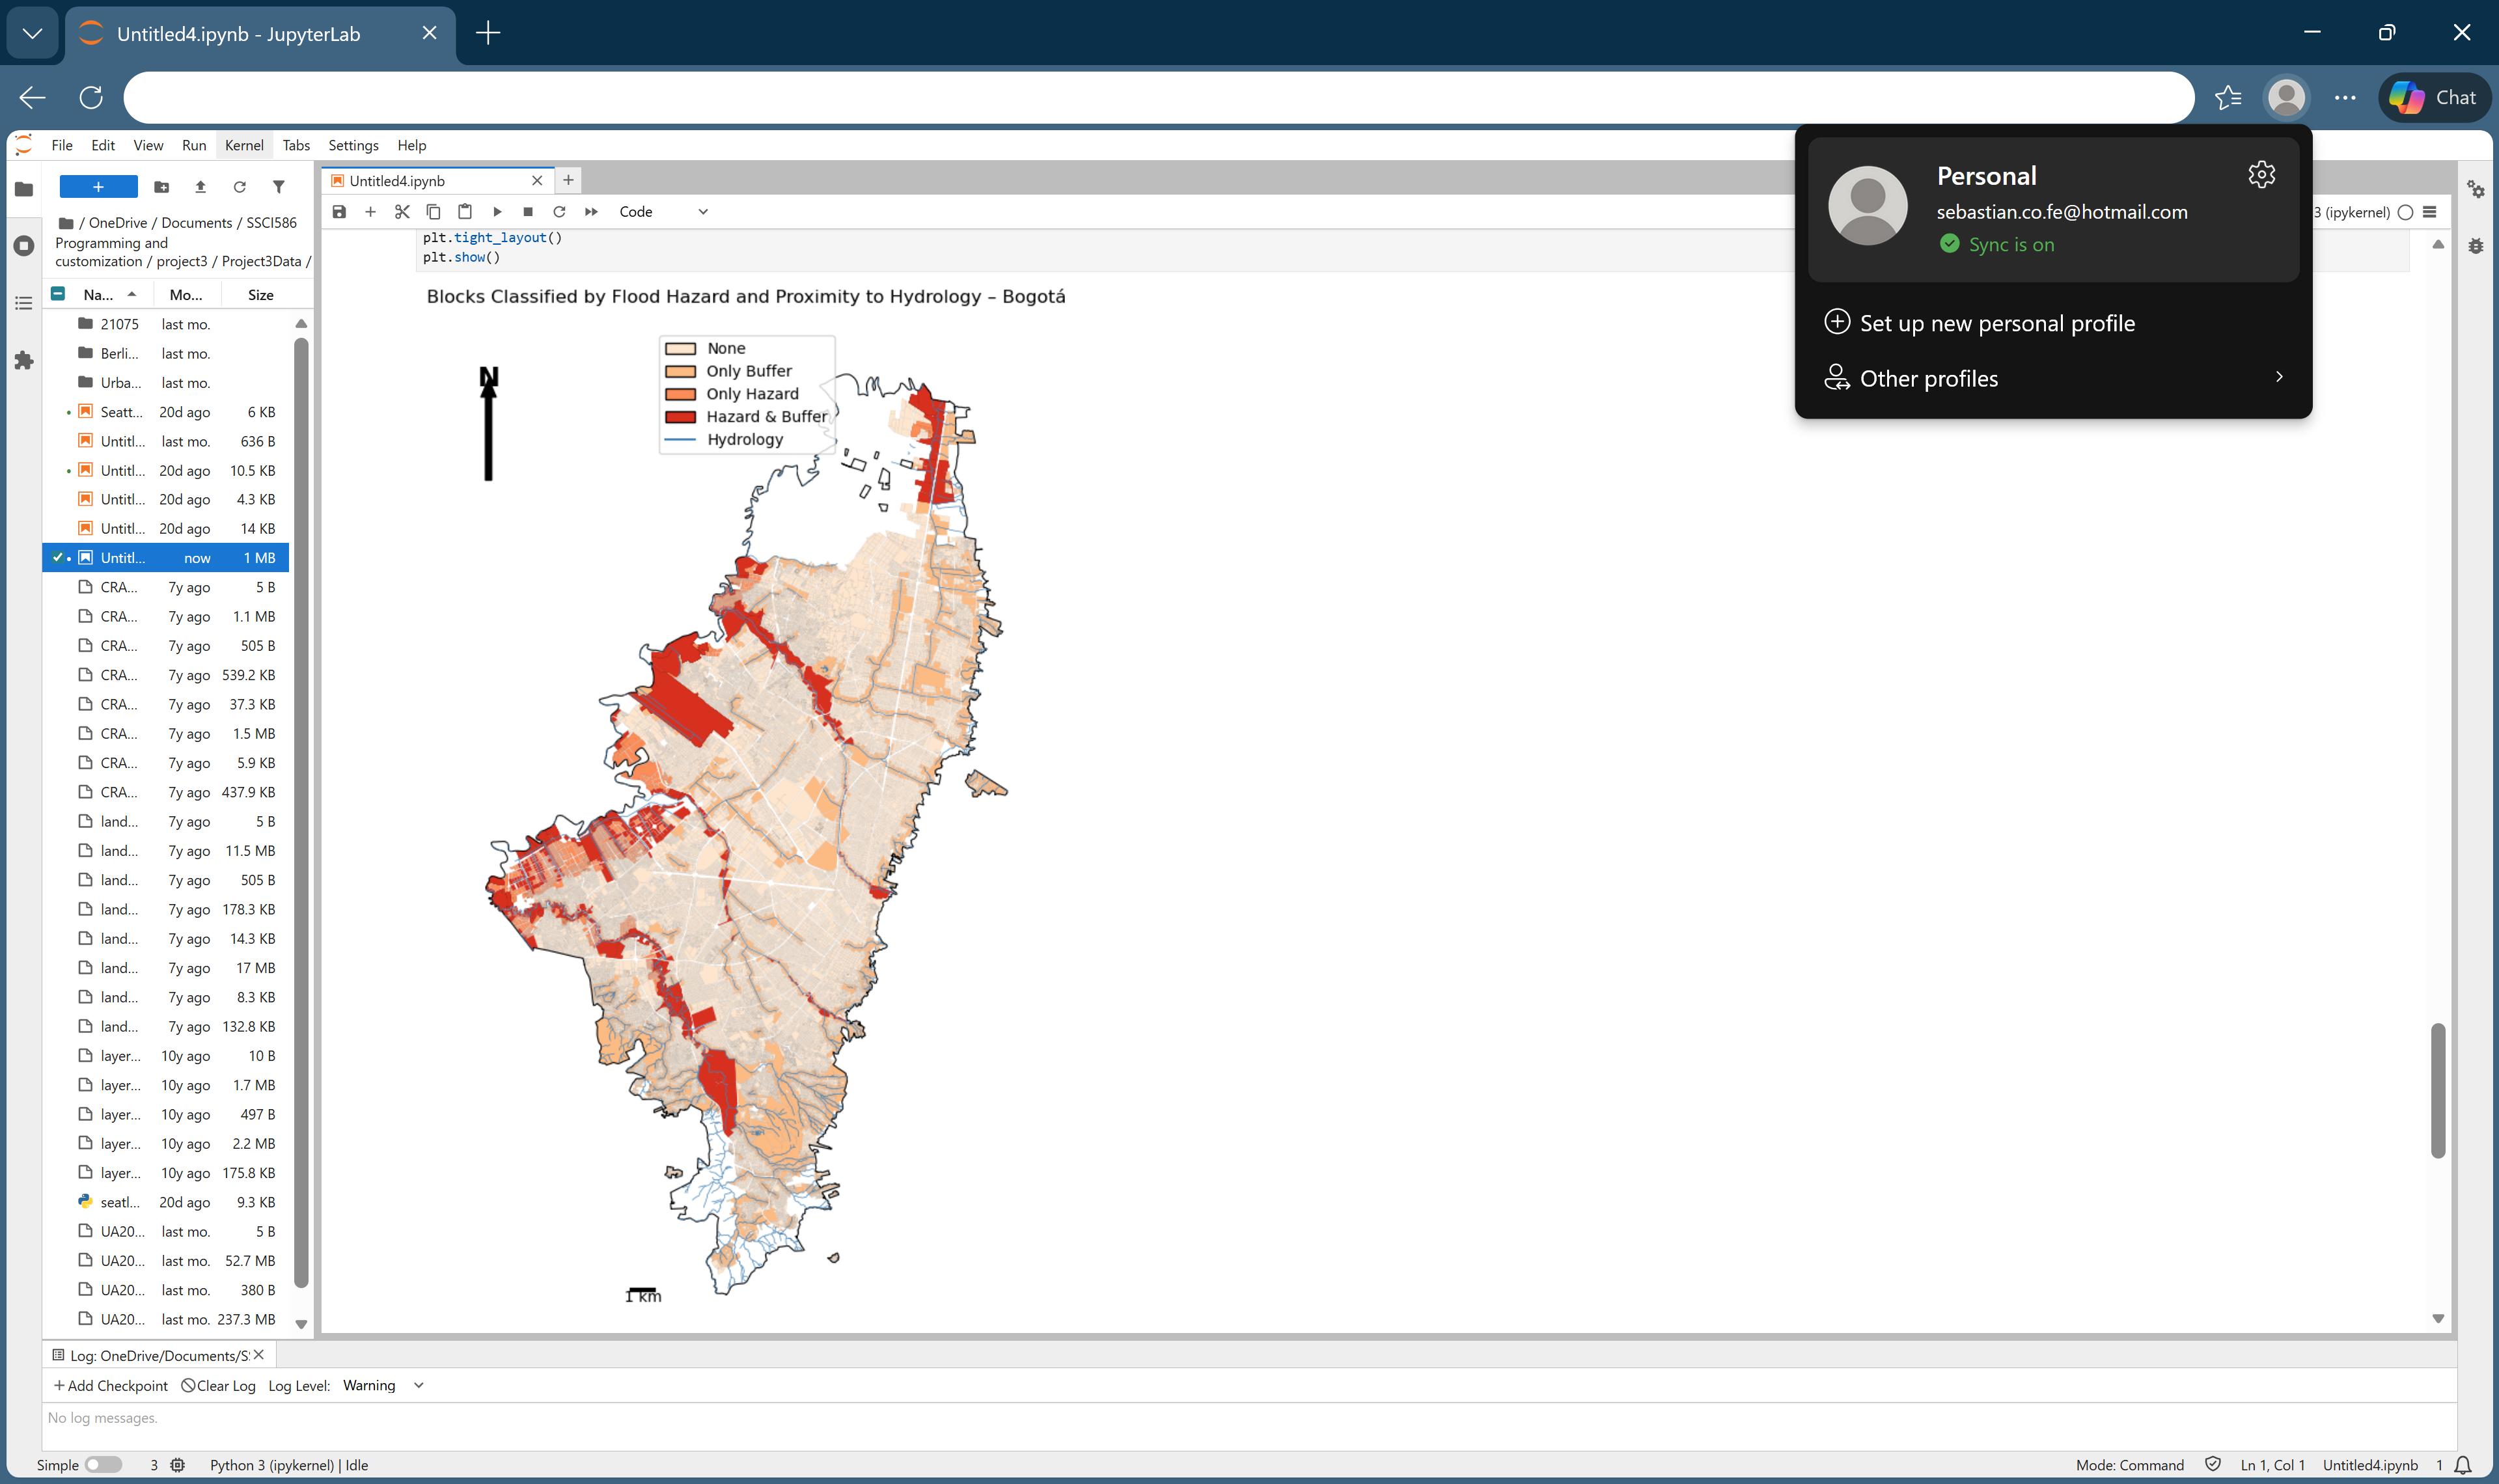
Risk classification map — blocks symbolized by RISK_CAT in four shades
ArcGIS Pro — Tool Execution & Layout
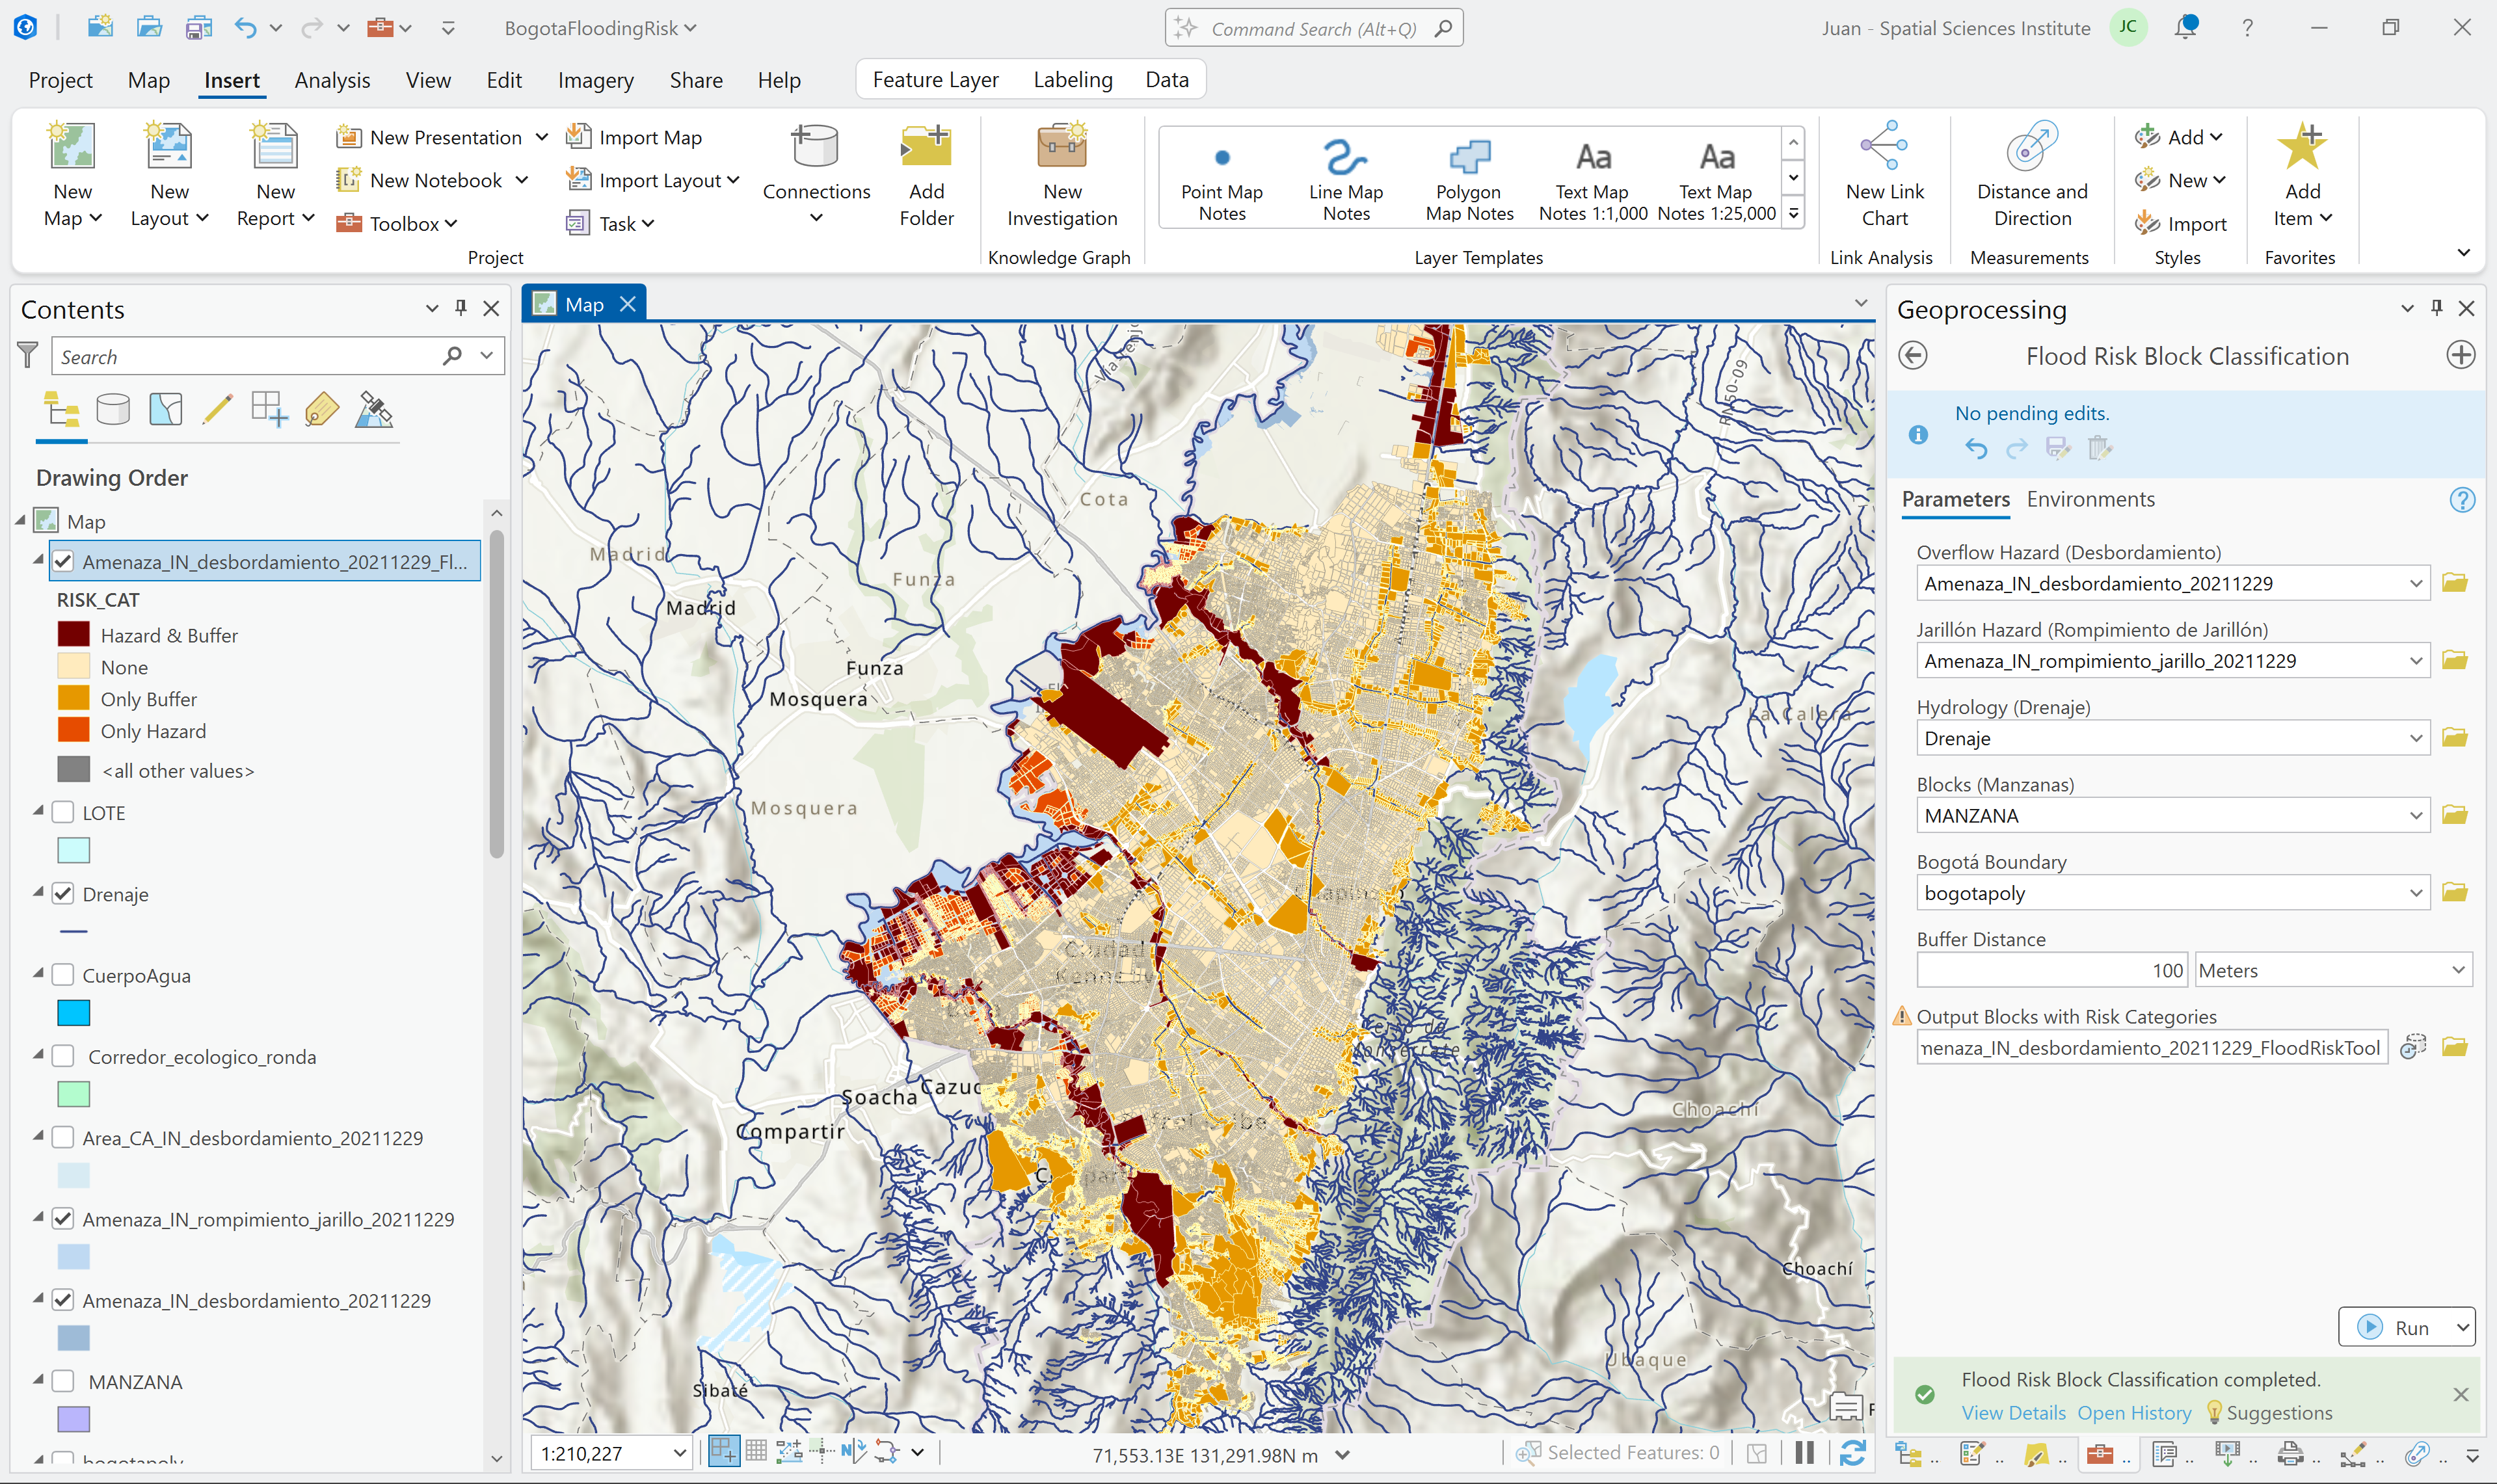
FloodRisk toolbox parameters panel (Geoprocessing pane) and completed ArcGIS Pro map layout
Final Risk Classification Map
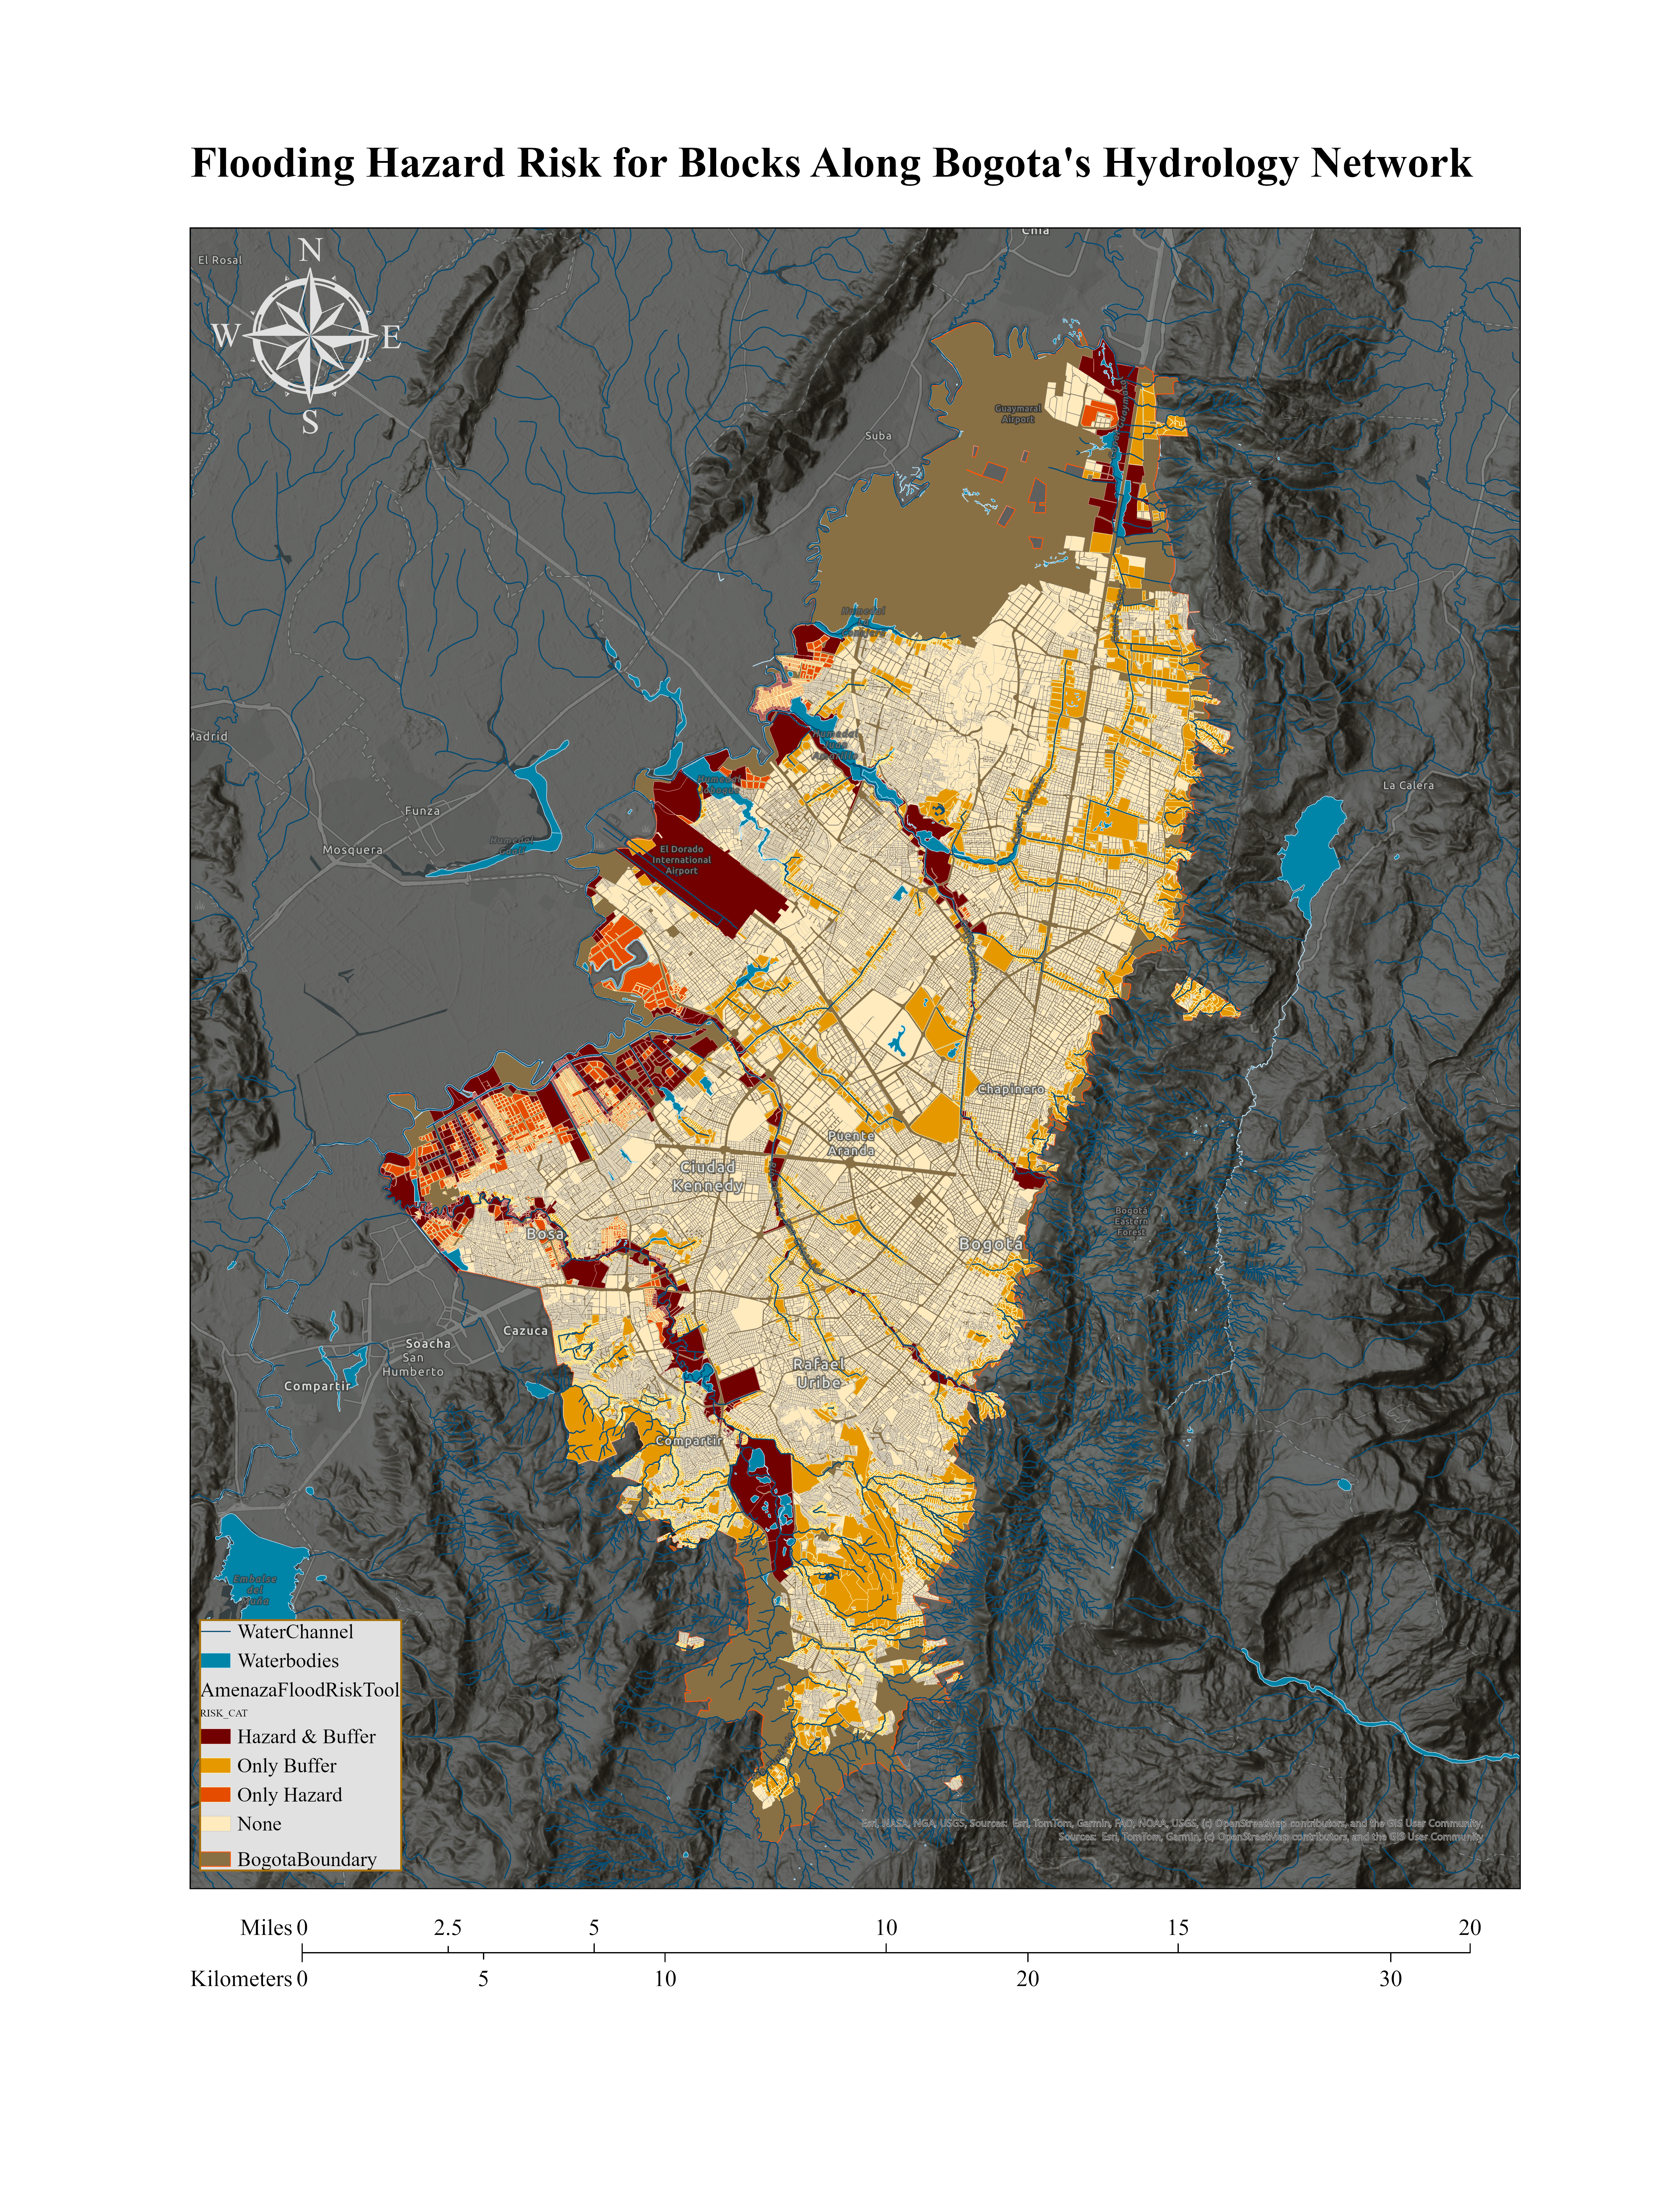
Flooding Hazard Risk for Blocks Along Bogotá's Hydrology Network — ArcGIS Pro cartographic output
Discussion
The analysis reveals that flood hazard in Bogotá is spatially concentrated along the western and southwestern drainage network, particularly near the Bogotá River and its tributaries. Blocks classified as "Hazard & Buffer" represent the highest-priority intervention areas, combining confirmed exposure in official hazard polygons with proximity-based hydrological risk.
Reproducing the workflow in both GeoPandas and ArcGIS Pro confirms the reproducibility of the approach across platforms. The Python toolbox format makes the workflow accessible to non-programmers through ArcGIS Pro's Geoprocessing pane, while the Jupyter Notebook provides full analytical transparency. Both maps communicate the same spatial pattern using consistent symbology.
Limitations
- Dataset vintage: The IDECA/IDIGER hazard polygons date from December 2021 and may not reflect conditions following recent urban development or updated flood modeling.
- Fixed buffer distance: The 100-meter hydrology buffer is a uniform proximity measure and does not account for terrain slope, channel capacity, or variable return-period flood extents.
- Block-level aggregation: Risk is assigned at the manzana (city block) level — individual parcels or buildings within a block may face heterogeneous exposure not captured at this resolution.
- Binary intersection logic: The
IN_HAZARDflag is binary — a block with only marginal edge overlap with a hazard polygon receives the same classification as one fully contained within it. - Static snapshot: The model represents conditions at a single point in time; seasonal variation in drainage capacity, storm recurrence intervals, and climate projections are not incorporated.