Overview
The Colombia Amphibian Explorer is a custom interactive web map visualizing the spatial and temporal distribution of 24 endemic and threatened amphibian species across Colombia, using observation data exported from iNaturalist. Built with the ArcGIS JavaScript API (v4.29) and published at amphibianexplorer.fyi, it combines citizen-science occurrence records with authoritative reference layers — IUCN Red List status, IGAC land cover, Köppen-Geiger climate zones, annual precipitation, and Colombia’s protected areas network.
The project has a dual purpose: raising awareness of Colombia’s uniquely vulnerable amphibian fauna, and making visible the geographic biases inherent in citizen science. By layering iNaturalist records over habitat context, the map lets users explore not just where amphibians have been recorded — but where they likely occur yet remain undocumented.
The glassfrog became both subject and metaphor: just as a glassfrog’s body reveals its interior through transparency, the map’s layers can be toggled to reveal ecological context beneath the occurrence data — deep greens, teal accents, and translucent overlays all inspired by Colombia’s glassfrog species.
Live Interactive Map
Embedded below — use the species sidebar to filter by IUCN status, click any species to load its photo, play its audio call, and zoom to its distribution. Toggle between the three map views in the layers panel.
Species by IUCN Conservation Status
Of the 24 species mapped, 5 are Critically Endangered — including Oophaga lehmanni, Atelopus lozanoi, Atelopus laetissimus, Oophaga solanensis, and Oophaga anchicayensis. Six are Endangered and three are Vulnerable.
Endangered
All 24 Species — Complete Dataset
| Common Name | Scientific Name | Status | Observations | Research Grade | Years | |
|---|---|---|---|---|---|---|
Emerald Glass Frog | Espadarana prosoblepon | LC | 2,140 | 1,746 | 1982–2026 | |
Spotted Foam-nest Frog | Leptodactylus insularum | LC | 922 | 649 | 2000–2026 | |
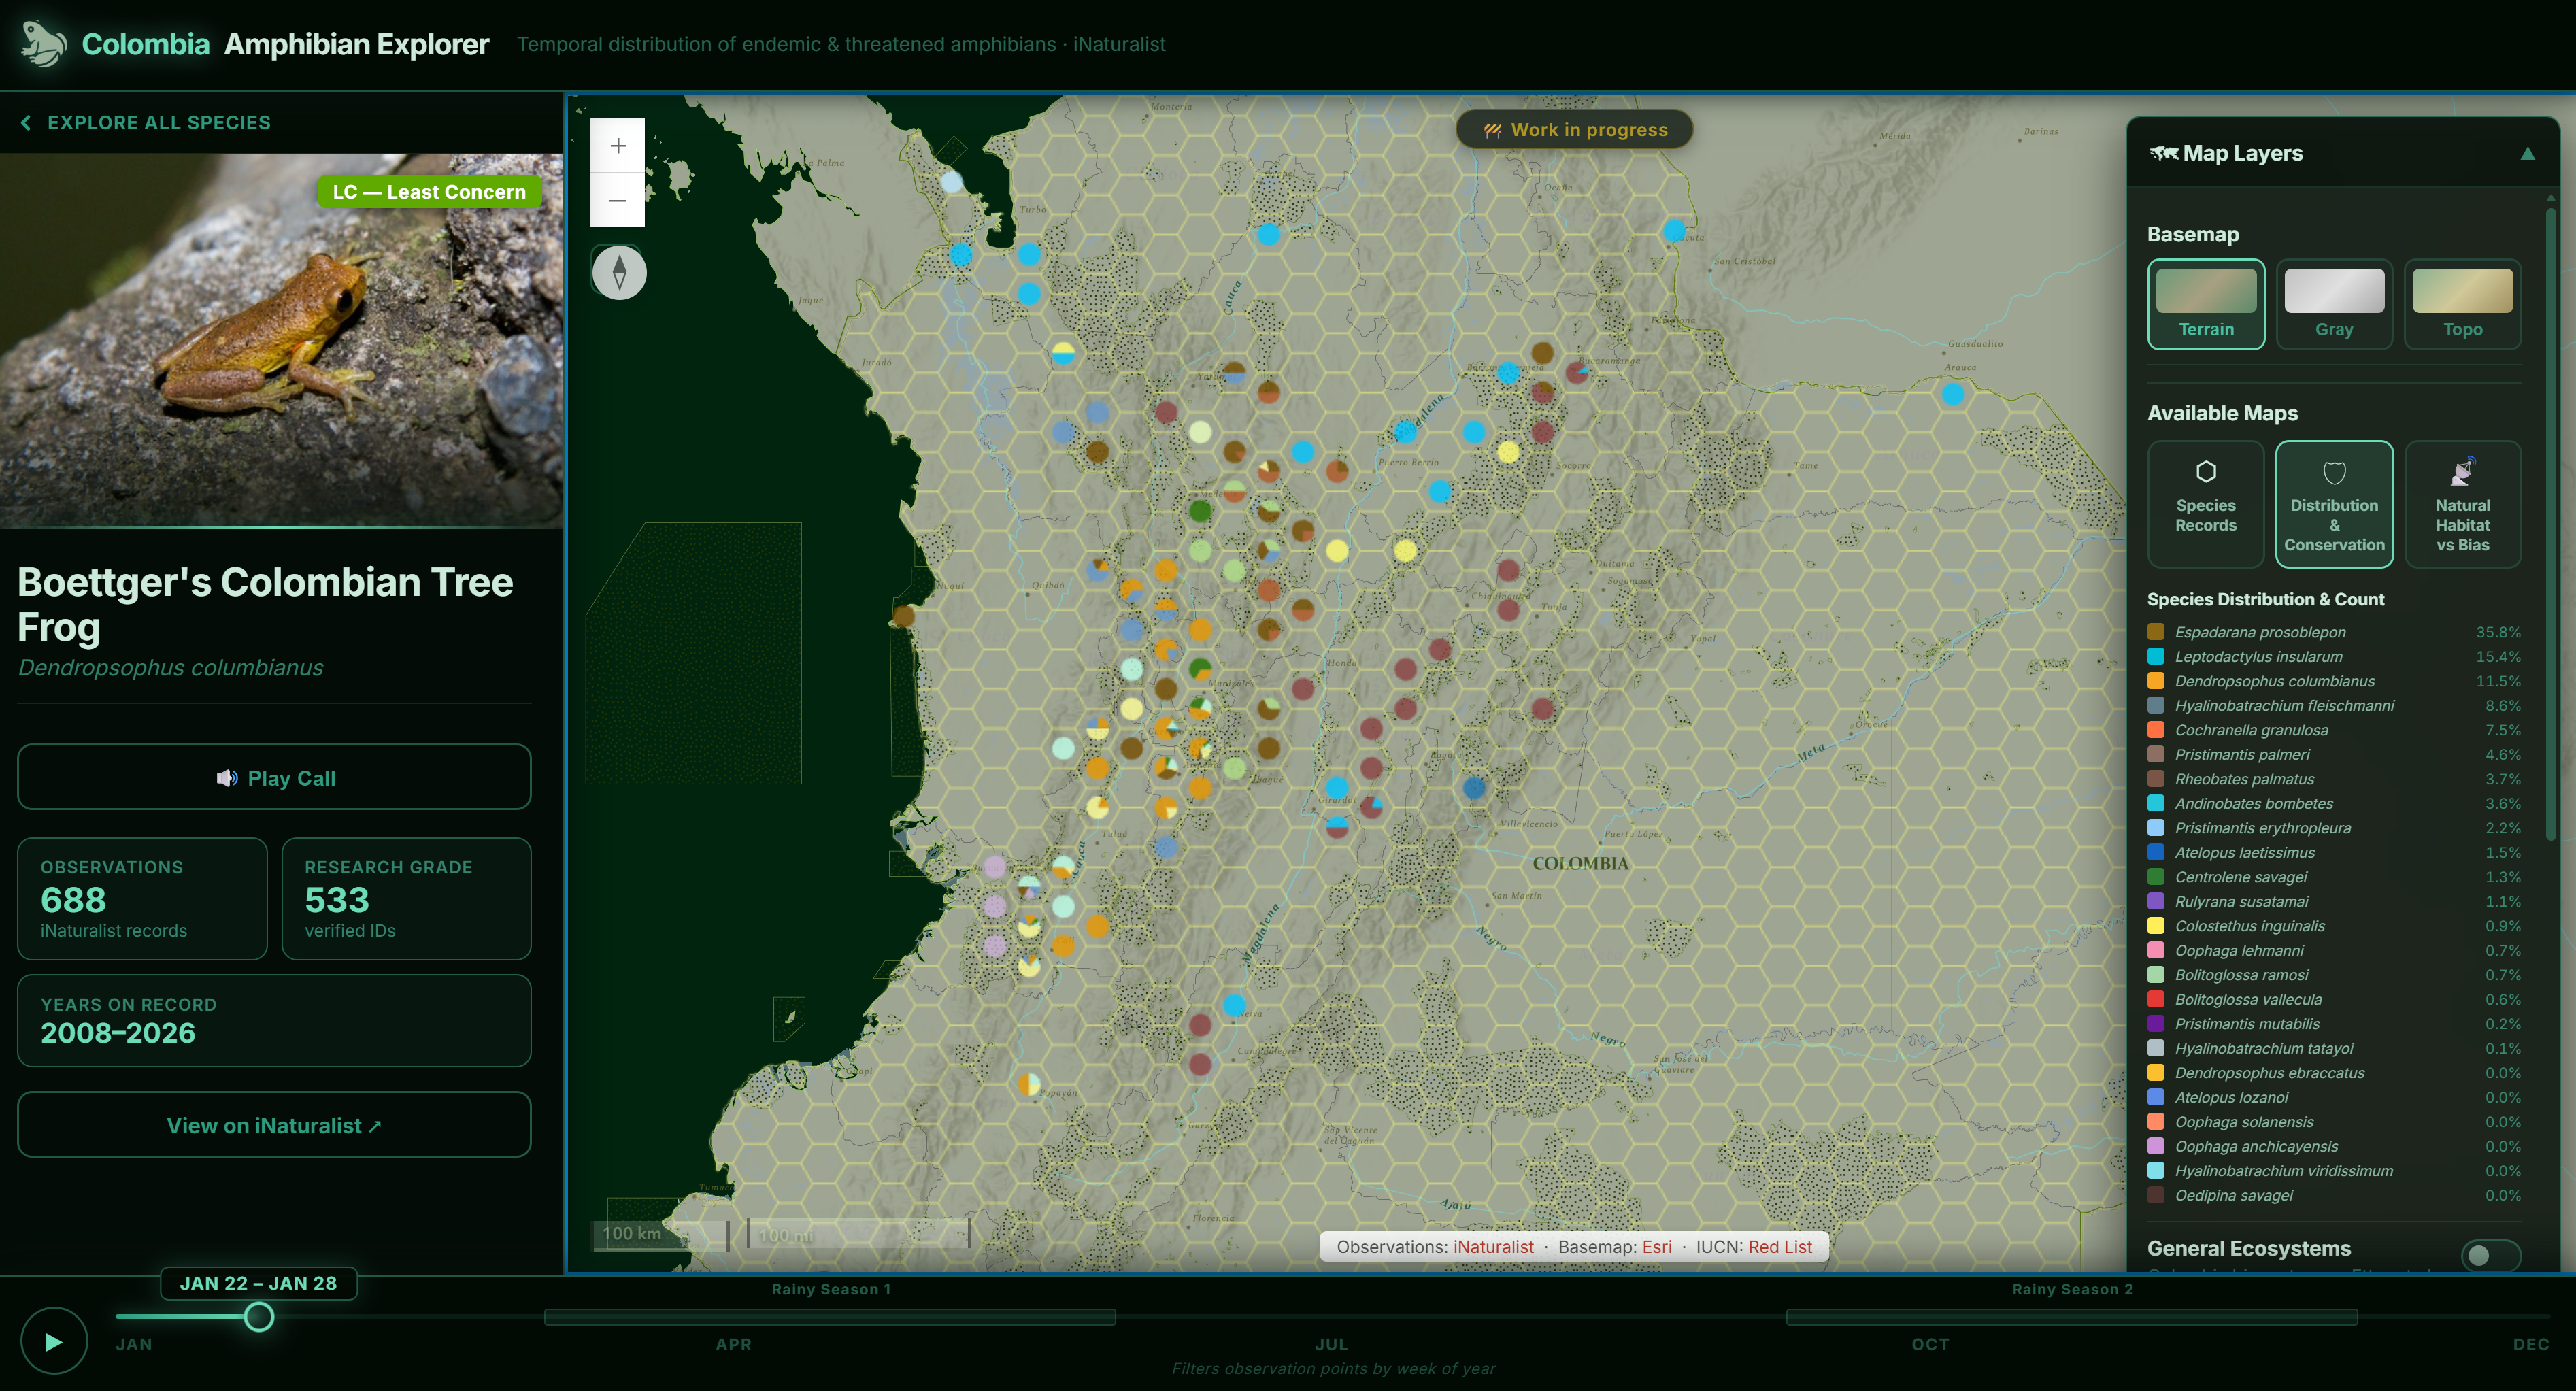
Boettger's Colombian Tree Frog | Dendropsophus columbianus | LC | 688 | 533 | 2008–2026 | |
Fleischmann's Glass Frog | Hyalinobatrachium fleischmanni | LC | 516 | 244 | 1969–2026 | |
Granular Glass Frog | Cochranella granulosa | LC | 395 | — | — | |
Colombian Robber Frog | Pristimantis erythropleura | EN | 234 | — | — | |
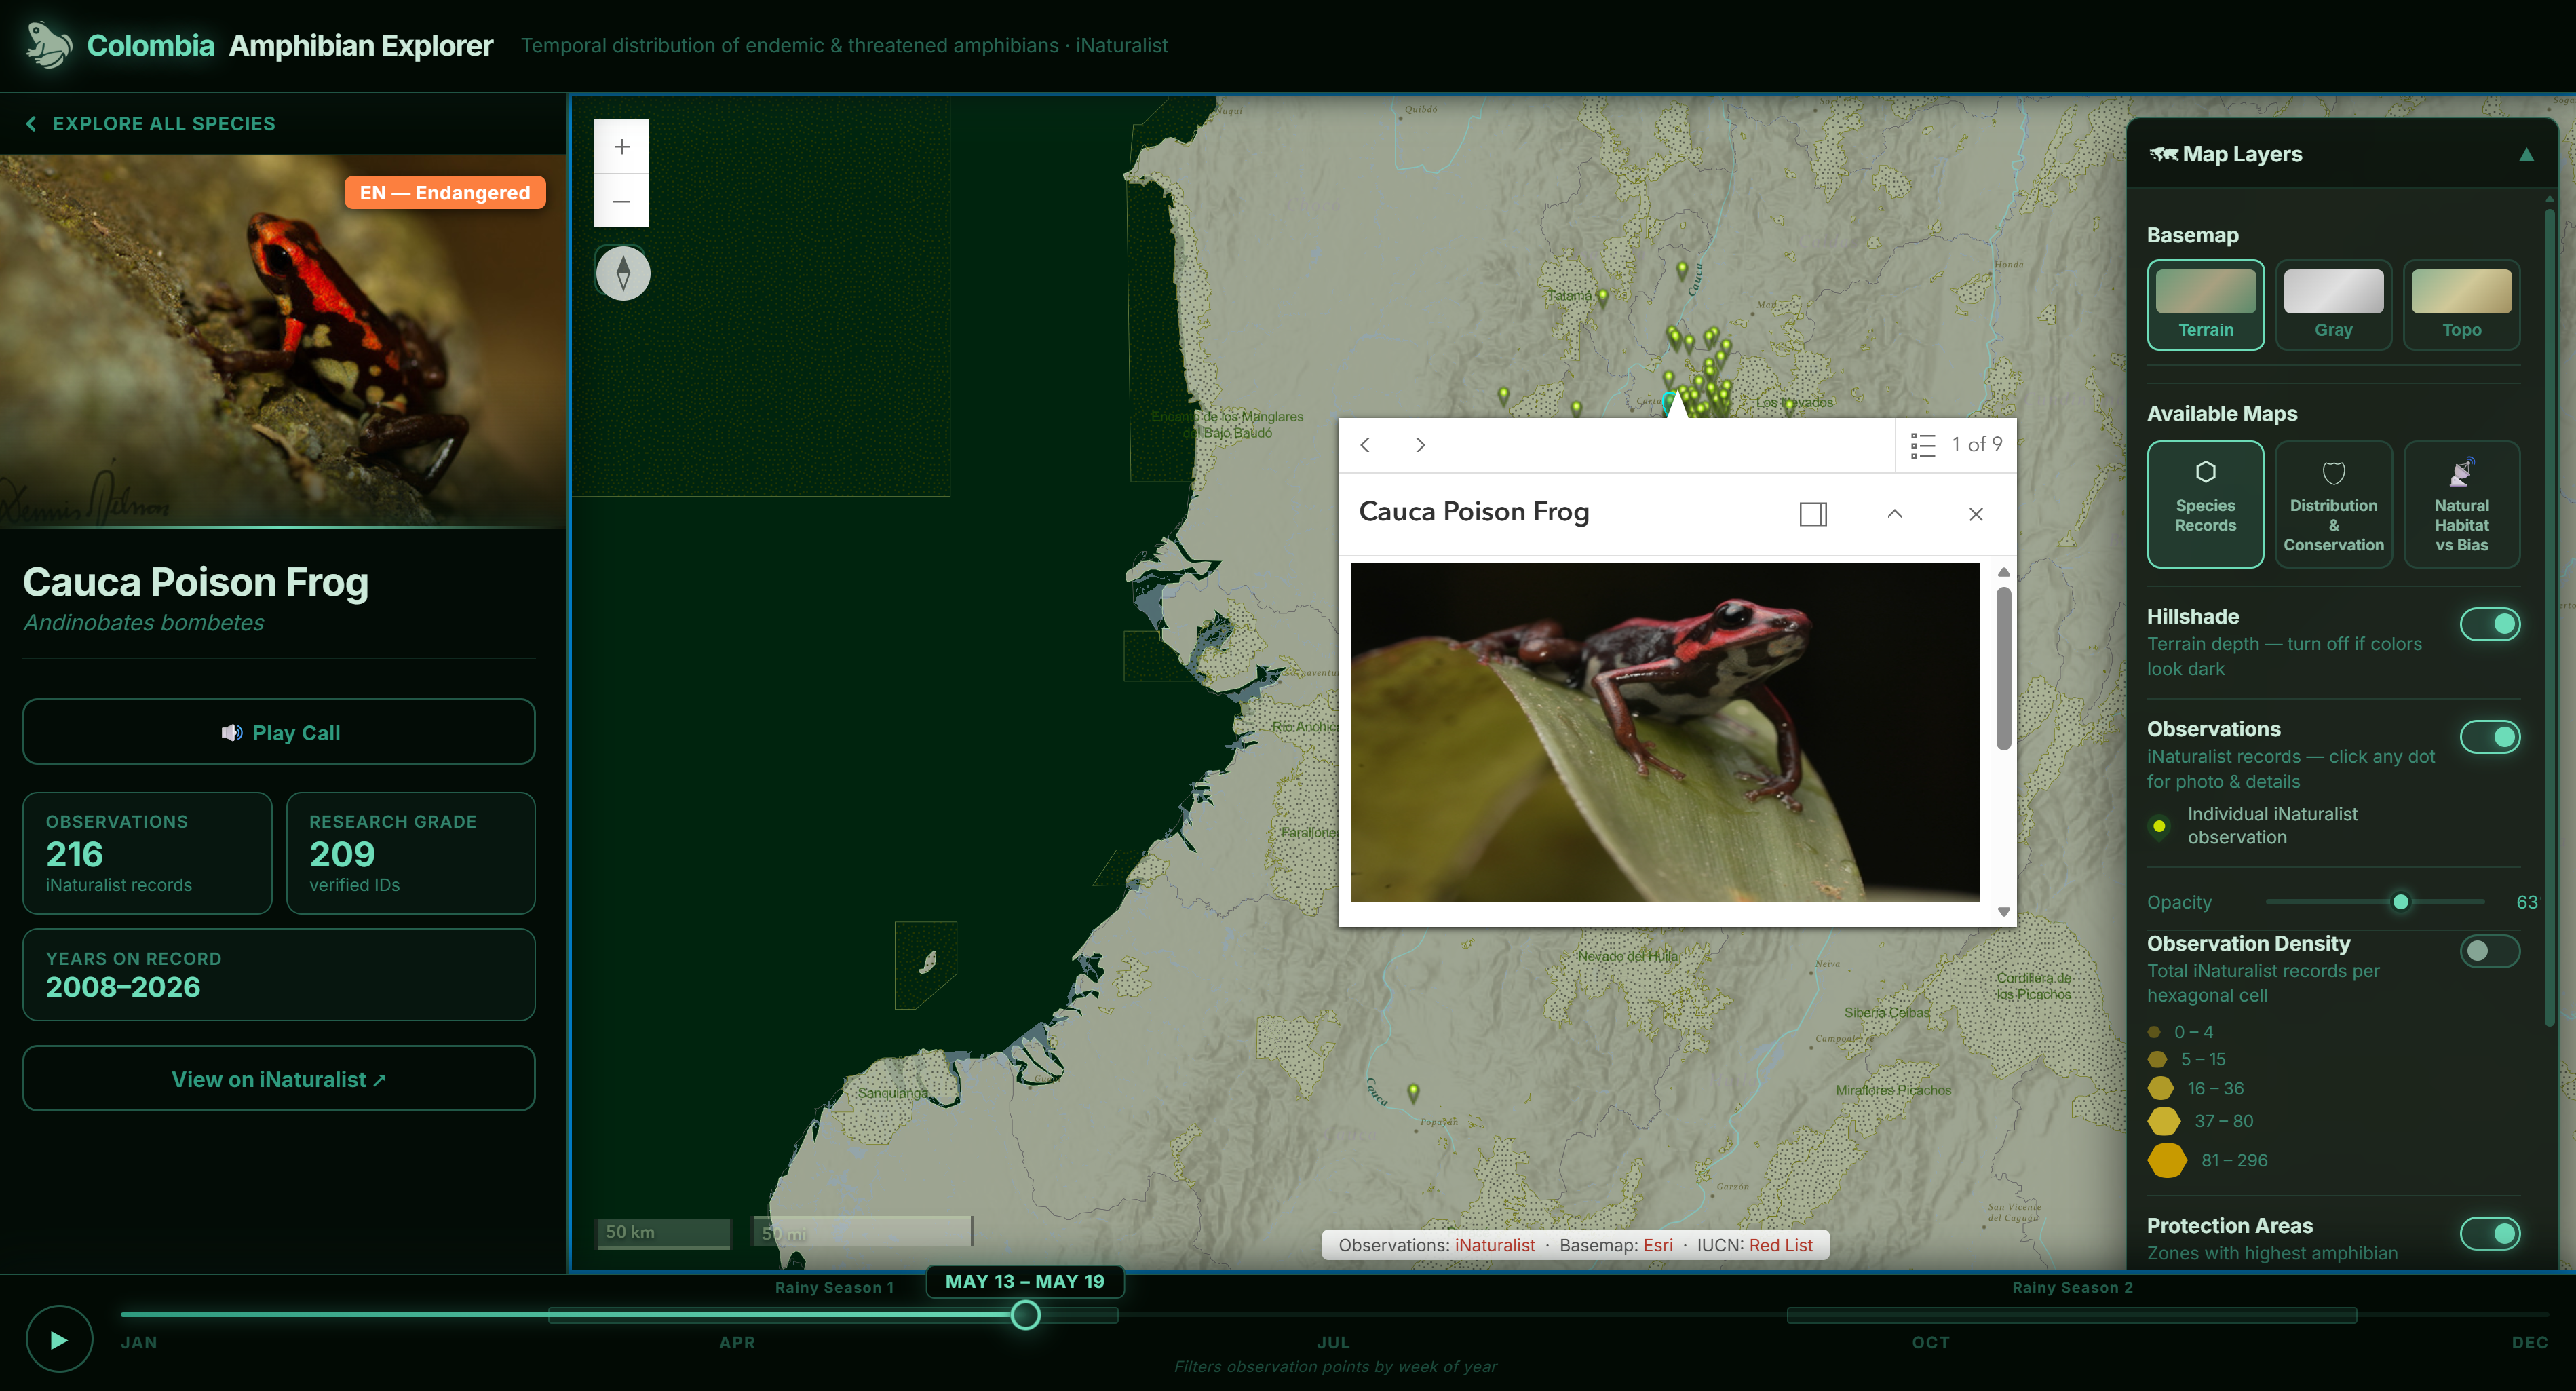
Cauca Poison Frog | Andinobates bombetes | EN | 216 | 209 | 2008–2026 | |
Palmer's Robber Frog | Pristimantis palmeri | VU | 216 | 129 | 2011–2026 | |
Palm Rocket Frog | Rheobates palmatus | LC | 129 | — | — | |
San Lorenzo Stubfoot Toad | Atelopus laetissimus | CR | 90 | 85 | 2008–2025 | |
Savage's Cochran Frog | Centrolene savagei | EN | 76 | 66 | 2007–2026 | |
Rulyrana susatamai | Rulyrana susatamai | LC | 68 | — | — | |
Common Rocket Frog | Colostethus inguinalis | LC | 56 | — | — | |
Red-banded Poison Frog | Oophaga lehmanni | CR | 42 | 36 | 2010–2026 | |
Ramos' Mushroomtongue Salamander | Bolitoglossa ramosi | EN | 39 | 25 | 2008–2026 | |
Yarmal Mushroom-tongue Salamander | Bolitoglossa vallecula | VU | 37 | 26 | 2017–2026 | |
Mutable Rainfrog | Pristimantis mutabilis | VU | 11 | 10 | 2012–2023 | |
Tatayo's Glass Frog | Hyalinobatrachium tatayoi | EN | 3 | 3 | 2012–2017 | |
Harlequin Treefrog | Dendropsophus ebraccatus | LC | 2 | 2 | 2023–2024 | |
Lynch's Stubfoot Toad | Atelopus lozanoi | CR | 2 | 2 | 2022–2025 | |
Chocó Poison Dart Frog | Oophaga solanensis | CR | 1 | 1 | 2023 | |
Oophaga anchicayensis | Oophaga anchicayensis | CR | 1 | 1 | 2025 | |
Northern Glassfrog | Hyalinobatrachium viridissimum | LC | 1 | 1 | 2010 | |
Savage's Worm Salamander | Oedipina savagei | DD | 1 | 1 | 2024 |
Three Map Views
Georeferenced iNaturalist points for all 24 species, enriched with species photos, audio call recordings, and timestamps. Click any dot for a full-detail popup with photo and link to iNaturalist.
Hexagonal density cells summarize observation clustering across Colombia. Protected areas, annual precipitation, and Köppen-Geiger climate zone layers provide habitat context. A time slider filters by week of year, revealing seasonal clustering during Colombia’s two rainy seasons.
Colombia subdivided into hexagonal cells, each displaying a pie chart of species richness. Areas of high biodiversity stand out against sparse cells at a glance.
An ecosystem layer beneath the hexagons identifies which ecosystems — Andean cloud forest, Chocó lowlands, Amazon basin — harbor the greatest species concentrations, highlighting regions where conservation efforts would have the greatest impact.
Integrates Colombia’s IGAC land cover classification (Corine Land Cover hierarchy, delivered as vector tiles) against iNaturalist observation density to expose collection bias.
The contrast is stark: observations cluster near Bogotá, Medellín, and accessible areas, while the Amazon basin, Pacific coast, and Orinoquía appear nearly empty — not because amphibians are absent, but because citizen scientists rarely reach these areas. The gaps are the finding.
Species sidebar — IUCN badge, photo, audio call, iNaturalist count, research-grade count, year range, and link to iNaturalist record.
Time slider filtering by week — seasonal observation patterns across Colombia’s two rainy seasons become visible in point distribution.
Design Decisions
Evokes the dense, layered character of Colombia’s ecosystems. Observation points and data layers read clearly against the dark background — essential when displaying hundreds of overlapping features at national scale.
Deep greens, teal accents, and translucent overlays directly inspired by Colombia’s glassfrog species. Toggling layers reveals ecological context beneath, just as a glassfrog’s transparency reveals its interior.
Sidebar interaction modeled after the Audubon Bird Migration Explorer — filter by IUCN status, sort by observation count or threat level, search by name. Clicking a species loads its photo, plays its audio call, and zooms the map to its distribution.
Audio recordings embedded for 17 of 24 species. Hearing a call alongside the spatial data creates presence a static map cannot — making the urgency of what’s at risk more immediate.
Technical Challenges
- 01Data pipeline: iNaturalist CSV exports required cleaning, validation, and enrichment — matching each species to IUCN Red List status, consolidating scientific and common names, and associating photo and audio URLs. Observations with uncertain identification quality grades were evaluated individually.
- 02Rendering performance: Displaying hundreds of points alongside hex-bin layers, ecosystem polygons, land cover tiles, and protected area boundaries required careful layer ordering and opacity management. IGAC Corine Land Cover was converted to vector tiles, trading some attribute richness for significantly improved rendering speed.
- 03Custom app architecture: Building a fully custom web application rather than ArcGIS Online Experience Builder introduced complexity in synchronizing the time slider, species filter, layer panel, and map view as a coherent interactive system — all coordinated with vanilla JavaScript and the ArcGIS JS API 4.29.
Citizen science data, while invaluable, must be critically interpreted and complemented by targeted field campaigns to meaningfully guide conservation decisions. This map makes that argument spatially — the empty regions of the Amazon and Pacific coast speak as loudly as the dense clusters around Bogotá and Medellín.